Two objects once identified as faint quasars because of their intense ultraviolet light are instead extreme star-forming galaxies whose spectra point to populations of very massive stars, with one galaxy showing such strong signatures that even the most massive-star models tested cannot fully reach its observed ultraviolet emission.
J1450−0144 and J1429−0104 were originally identified as quasars in the Subaru High-z Exploration of Low-Luminosity Quasars survey. Both had the combination that made them plausible faint quasars at the time: blue ultraviolet continua, strong Lyα emission and ultraviolet absolute magnitudes around −23.5. J1429−0104 was measured at a redshift of 6.8, while J1450−0144 was placed at 6.63.
New observations with the James Webb Space Telescope’s NIRSpec instrument give a very different picture. Rather than the broad emission lines expected from an unobscured type-I quasar, both objects have spectra dominated by signatures associated with young, intensely star-forming stellar populations. They show blue ultraviolet continua, prominent P Cygni profiles in high-ionization lines including N V, Si IV and C IV, broad He II emission, and narrow nebular lines such as [O II] and [Ne III]. Neither has broad Lyα or broad Mg II emission.
The distinction matters because P Cygni profiles have a particular shape. Each has a blueshifted absorption component accompanied by a redshifted emission component near the systemic velocity. In these galaxies, the profiles are characteristic of expanding stellar winds. The C IV and N V absorption reaches roughly 20–50 percent of the surrounding continuum, while the emission peaks are comparably prominent. J1450−0144 also shows a P Cygni profile in N IV at 1719 Å.
That combination also argues against interpreting the absorption as a broad-absorption-line quasar. A BAL outflow would produce the blueshifted absorption, but not the corresponding stellar-wind-like emission peak at the systemic velocity. The spectra instead match the ultraviolet composite of extreme UV-luminous galaxies and closely resemble the spectrum of the seven most massive stars observed in the R136 cluster.
The two sources therefore become the first spectroscopically confirmed extreme UV-luminous galaxies in the paper’s sample at redshift above 6.5 with ultraviolet magnitudes brighter than −23.
The strongest clue is an unusually broad helium line
The most striking feature is broad He II emission at 1640 Å. In J1450−0144, the line has a full width at half maximum of about 1,900 kilometers per second and a rest-frame equivalent width of 8.8 ± 1.2 Å when measured directly from the continuum-subtracted spectrum. In J1429−0104, the corresponding width is about 2,200 kilometers per second and the equivalent width is 3.7 ± 1.1 Å.
The widths are too large for a purely narrow nebular origin. A conventional quasar broad-line region is also disfavored because neither galaxy has the accompanying broad Lyα emission that would be expected if the broad lines came from such a region. The narrow Mg II emission provides another distinction. Its widths are only about 200–500 kilometers per second, consistent with nebular rather than broad-line-region emission.
The authors instead attribute the broad features to dense, radiatively driven winds from young massive stars. In particular, the combination of strong He II and the P Cygni profiles points toward hydrogen-rich, very massive stars whose winds can produce Wolf-Rayet-like spectra while the stars are still burning hydrogen in their cores.
The other emission lines fit the same picture. Both galaxies have narrow [O II] and [Ne III] emission, with widths of roughly 330–670 kilometers per second. Their measured [Ne III]/[O II] ratios correspond, using the calibration adopted by the authors, to an oxygen abundance of about 12 + log(O/H) ≈ 8.0, or roughly 0.2 times the solar oxygen abundance. The authors treat this as a working metallicity estimate because the available spectrum does not include the rest-frame optical lines needed for a more direct diagnostic.
Their ultraviolet continua are also blue, with slopes of β = −2.20 ± 0.09 for J1450−0144 and −2.06 ± 0.07 for J1429−0104. The authors note that nebular continuum emission can alter such slopes at the very young ages relevant here, so the dust attenuation inferred from the continuum should be regarded as an upper limit.
Standard stellar models cannot reproduce the helium emission
To test whether ordinary massive stars could account for the spectra, the researchers fitted the ultraviolet wind features using two families of stellar-population models.
The first was the standard BPASS model grid, with initial-mass-function upper limits of 100 and 300 solar masses. Those models could reproduce the N V and C IV P Cygni profiles, but they consistently underpredicted the broad He II emission. Even the models extending the initial mass function to 300 solar masses did not generate enough He II.
The second model family added dedicated treatments of very massive stars, using models from Martins and Palacios incorporated into BPASS. This grid extended the upper mass limit from 175 to 475 solar masses and included the dense stellar winds expected for stars close to the Eddington limit.
Those models reproduce the combination that the standard models miss: the strong broad He II emission together with the N V and C IV P Cygni profiles. For J1450−0144, the best-fitting model also produces broad N IV] emission and a P Cygni feature at N IV 1719, both of which are observed in the galaxy. The N IV] feature in J1429−0104 is only marginally detected.
The result points to an important distinction. Simply allowing stars above 100 solar masses is not enough. The strong He II appears in the models only when the dedicated atmosphere and wind physics of very massive stars is included. The authors identify those dense, optically thick winds as the key ingredient needed to produce the observed emission.
One galaxy looks like an especially young burst
The modeling gives the clearest age constraint for J1450−0144. Its BPASS-plus-VMS fit favors a star-formation duration of about 3.2 million years, with acceptable solutions concentrated around roughly 2–4 million years. Its best-fit stellar mass is log(M★/M☉) = 9.24, and the corresponding star-formation rate is about 544 solar masses per year.
J1429−0104 is more difficult to pin down. Its formal best fit in the same model grid is much older, about 25 million years, with an upper mass limit of 325 solar masses, a stellar mass of log(M★/M☉) = 9.88 and a star-formation rate of about 300 solar masses per year. But the age–upper-mass combination is highly degenerate. A younger population with a lower upper-mass limit can reproduce the data nearly as well, and the authors exclude only the combination of an age below about 3 million years with an upper mass limit above about 325 solar masses.
The resulting star-formation rates are higher than the approximately 135 solar masses per year estimated from the ultraviolet luminosity alone. The authors interpret the difference partly as a distinction between total and unobscured star formation, and partly as a consequence of applying a fixed ultraviolet conversion factor to populations whose ultraviolet light has not yet reached its equilibrium level.
The very massive stars themselves appear to make up a substantial part of the ultraviolet-emitting population. Using a Salpeter initial mass function extending to 300 solar masses, the authors estimate that a galaxy forming about 10⁹ solar masses of stars would produce roughly 2 × 10⁵ stars above 100 solar masses at birth. Given the inferred stellar masses and young ages of the two galaxies, they estimate that each could contain on the order of at least 10⁵ very massive stars at birth, with a comparable number still alive.
The ultraviolet spectra provide an independent check. The deep C IV absorption troughs imply that roughly 50–80 percent of the ultraviolet continuum could arise from stars with dense winds, although the authors stress that this is an upper limit because ordinary early-O stars can also contribute to the absorption and because incomplete saturation and overlapping velocity profiles can fill in the trough.
The inferred upper stellar masses are high, but model-dependent
The authors also use the He II, N V and C IV equivalent widths to constrain the upper end of the stellar initial mass function.
J1429−0104 is consistent with an upper mass of at least about 225 solar masses in these diagnostics. J1450−0144 lies beyond the model grid at the highest He II strengths, with the diagnostic favoring the upper end of the tested range, between roughly 225 and 475 solar masses.
Those numbers should not be treated as direct measurements of individual stellar masses. The authors emphasize that the inferred upper-mass cutoff depends strongly on the adopted stellar-wind prescription. The models use a mass-loss prescription calibrated on very massive stars in the Large Magellanic Cloud, and there are no empirical constraints on such winds at other metallicities. The predicted He II strength at a given upper mass can also change substantially depending on how the assumed wind mass loss scales with metallicity. The model grid further fixes the high-mass initial mass function to a Salpeter slope.
For that reason, the authors regard the presence of a substantial very massive-star population as the more robust result. Determining the exact upper-mass cutoff or the detailed shape of the high-mass initial mass function will require better-calibrated wind models and deeper spectra of more galaxies.
ALMA finds large reservoirs of gas, but the galaxies differ in dust
The ultraviolet observations are complemented by ALMA measurements of the [C II] 158-micron line.
Both galaxies have strong [C II] emission. J1450−0144 has a luminosity of about 0.8 × 10⁹ solar luminosities, while J1429−0104 reaches about 4.1 × 10⁹ solar luminosities. The authors use an empirical [C II]-to-molecular-gas calibration to estimate molecular gas masses of about 2.4 × 10¹⁰ solar masses for J1450−0144 and 1.24 × 10¹¹ solar masses for J1429−0104, while cautioning that the calibration has substantial intrinsic scatter and has not been tested specifically on extreme UV-luminous galaxies.
The two systems diverge sharply in their infrared emission.
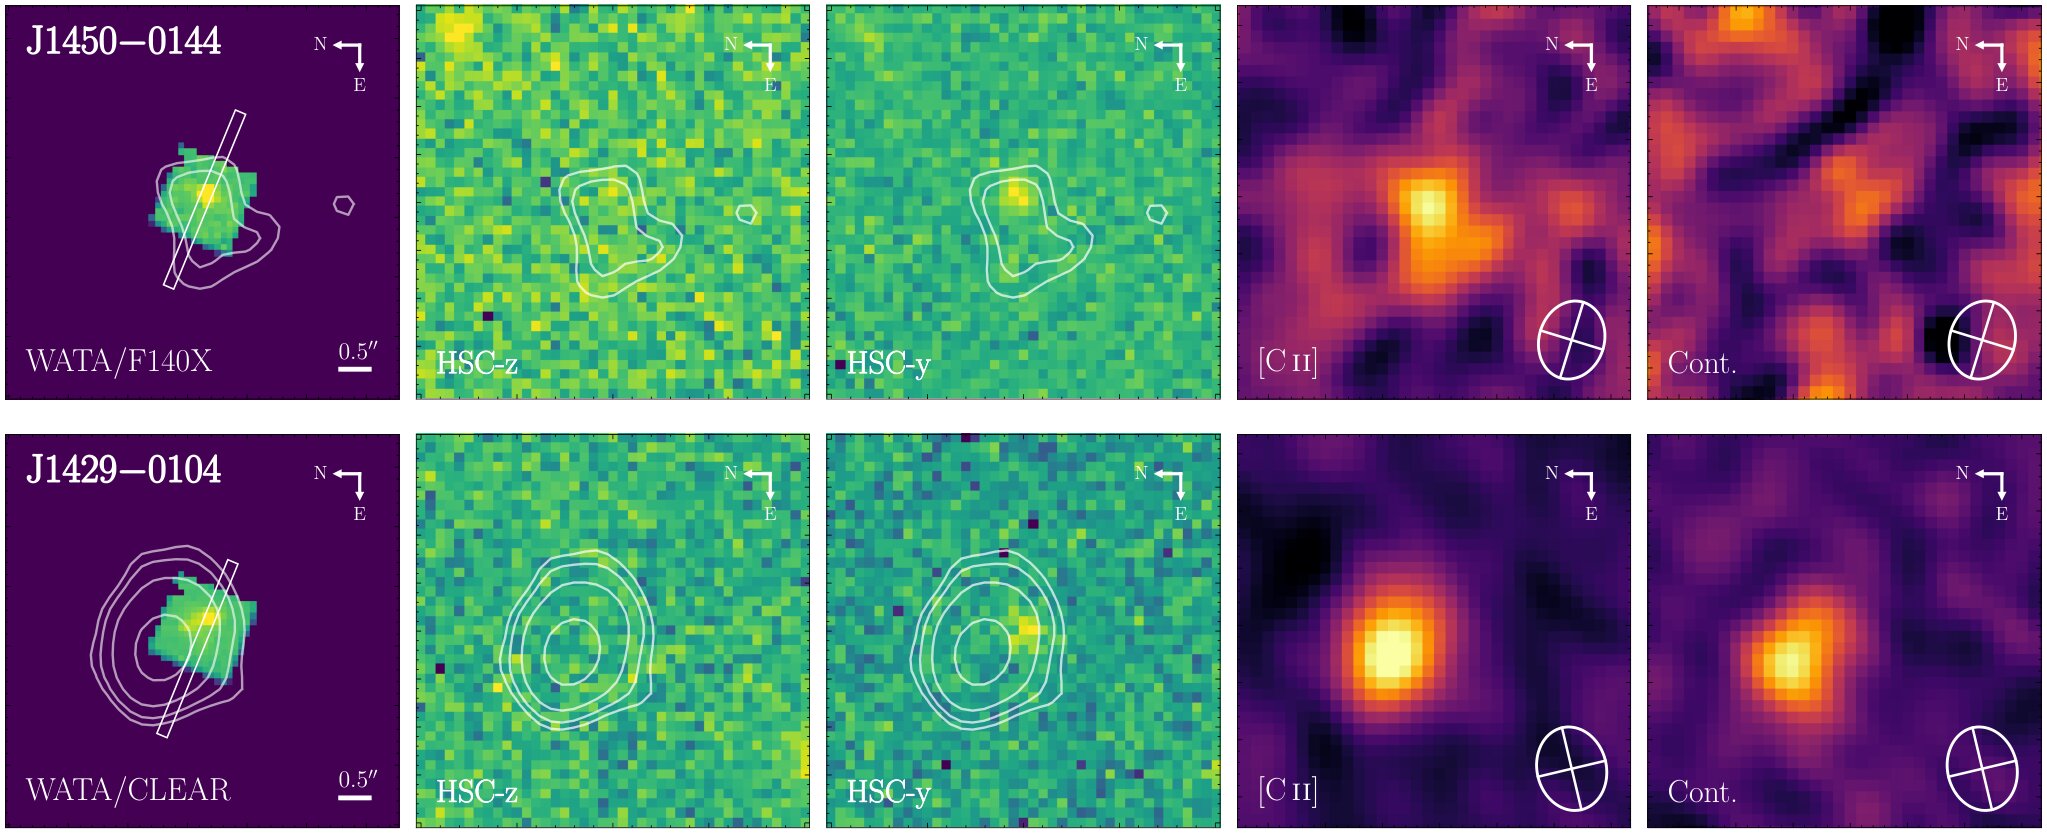
J1429−0104 is detected in ALMA’s dust continuum. Its total infrared luminosity is about 2.6 × 10¹² solar luminosities, corresponding to an obscured star-formation rate of about 310 solar masses per year. The authors estimate a dust mass of roughly 1.2 × 10⁸ solar masses. In contrast, J1450−0144 is not detected in the dust continuum at the available sensitivity, leaving only an upper limit on its infrared emission.
The dust in J1429−0104 is also not centered on the ultraviolet-emitting region. The dust and [C II] emission are displaced by about 5.4 kiloparsecs from the ultraviolet emission. The authors discuss several possible explanations, including a merger, an obscured star-forming component or the displacement of dust by radiation-driven outflows, but the current observations cannot distinguish among them.
The morphology seen by JWST adds another difference. J1450−0144 is unresolved at roughly 0.1 arcsecond, corresponding to about 500 parsecs at its redshift. J1429−0104 has a compact ultraviolet core but also extended structure to the southeast. The authors say that higher-resolution, multi-filter imaging or integral-field spectroscopy will be needed to determine the nature of the different components.
Two galaxies change the accounting at the bright end
The revised classification also affects estimates of how many extremely UV-luminous galaxies exist at this epoch.
Because both objects were originally selected as part of the SHELLQs quasar sample, the researchers could use the survey’s existing selection volume to estimate a lower limit on the number density of similar EUVLGs. After combining the two adjacent quasar-luminosity bins containing the objects, six sources fall in the merged interval and two are now known to be EUVLGs. This gives a lower limit of about 0.28 Gpc⁻³ mag⁻¹ at M₁₄₅₀ ≈ −23.5 and redshift around 7.
The authors stress that this is only a lower limit. The original quasar selection favored objects with quasar-like colors and strong Lyα emission, so EUVLGs with weaker Lyα, different colors or morphologies that failed the point-source selection could have been missed. In addition, only these two SHELLQs objects have so far been reclassified through the new spectroscopy, leaving open the possibility that more objects in the same luminosity and redshift range could change classification after follow-up.
That uncertainty is especially important because the luminosity range around M₁₄₅₀ ≈ −23 to −25 is where the faint quasar population and the extreme bright end of the galaxy population overlap. The study therefore finds that classifications based on shallow discovery spectra can blur the distinction between the two populations.
The authors do not yet attempt to establish how common these galaxies are at redshift around 7. The current sample is too small, and the selection itself is incomplete. They instead treat the measured number density as a lower limit and note that a larger spectroscopic sample is needed to determine the fraction of bright sources that are actually extreme star-forming galaxies.
The evidence points to very massive stars, while several details remain open
The central result rests on several pieces of the same spectrum rather than on a single emission line. The two objects have the ultraviolet luminosities of faint quasars, but their detailed spectra instead show the combination of stellar-wind P Cygni profiles, broad He II and narrow nebular emission expected from extreme young star-forming populations. Standard BPASS models reproduce some of the wind features but fail on the strength of He II, while models with dedicated very massive-star wind physics reproduce the combination.
The strongest case is J1450−0144, whose He II emission is so pronounced that its position in the diagnostic diagrams extends beyond most comparison systems and beyond the model grid at the highest strengths. J1429−0104 falls within the model tracks but has weaker constraints because age and upper stellar mass can compensate for each other in the ultraviolet wind features.
There are still uncertainties in the detailed interpretation. The observed C IV profiles contain more complex structure than the models, and the C IV equivalent widths are not fully consistent with the ages favored by the He II and N V diagnostics. The models also generally predict a P Cygni profile in He II that is not clearly observed. The authors find that measuring only the red emission wing of He II does not change the overall conclusion about the substantial very massive-star population, but they emphasize that more detailed modeling is needed.
The study therefore stops short of assigning a precise maximum stellar mass to either galaxy. What survives the modeling uncertainties is the evidence that the ultraviolet light of these two exceptionally bright galaxies contains a substantial contribution from very massive stars, and that their spectra can make them look like quasars when observed without the detailed ultraviolet information provided by JWST.
The study was posted to the arXiv preprint server.