Earth, our pale blue dot adrift in the great cosmic sea, resides in a relatively quiet neighborhood—roughly 26,000 light-years from the chaotic, brilliant heart of the Milky Way. There, at the very core of our spiral galaxy, lies a region unlike any other: the Central Molecular Zone, or CMZ. This galactic center, obscured from our view by thick layers of dust and gas, has long held its mysteries close. But thanks to pioneering efforts from the Milky Way Laboratory at the University of Connecticut, researchers are finally starting to see it with new eyes.
In a groundbreaking series of studies, astrophysicist Dr. Cara Battersby and her team have pieced together the most comprehensive 3D model yet of this turbulent galactic engine. Their work, published across four detailed papers in The Astrophysical Journal, unravels a region that not only governs how stars are born but also determines how energy—and potentially even dark matter—moves through our galaxy.
Welcome to the cosmic way station.
The Way Station at the Heart of the Galaxy
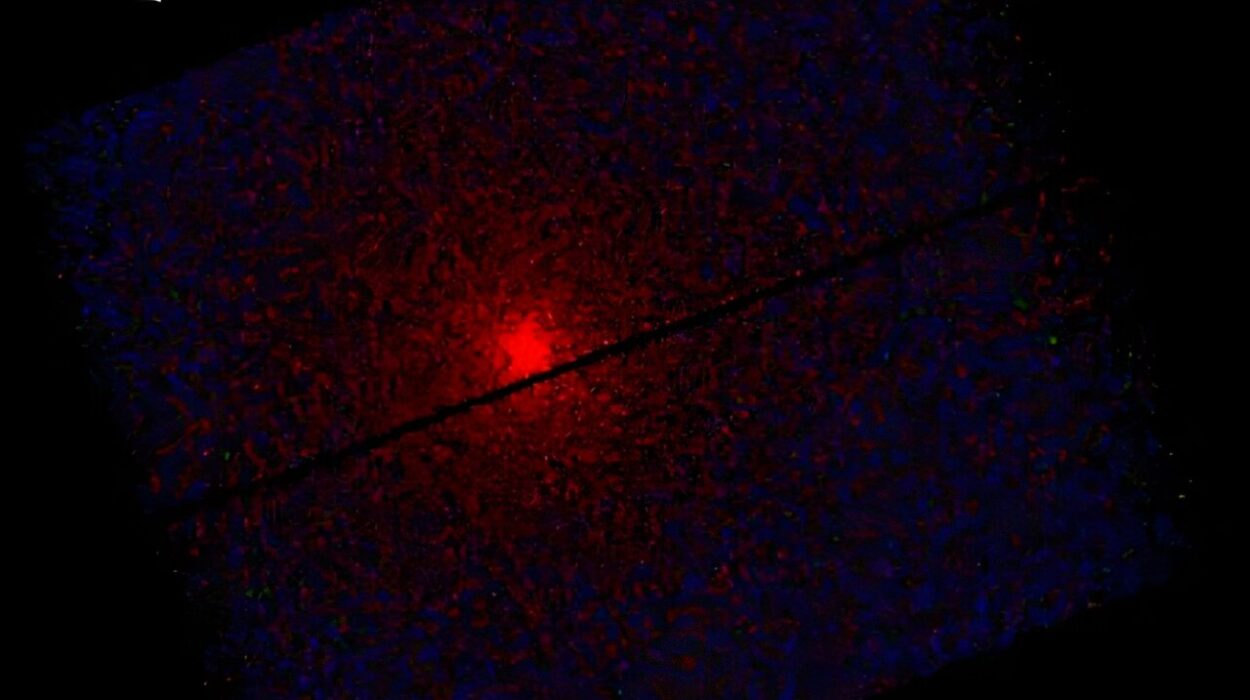
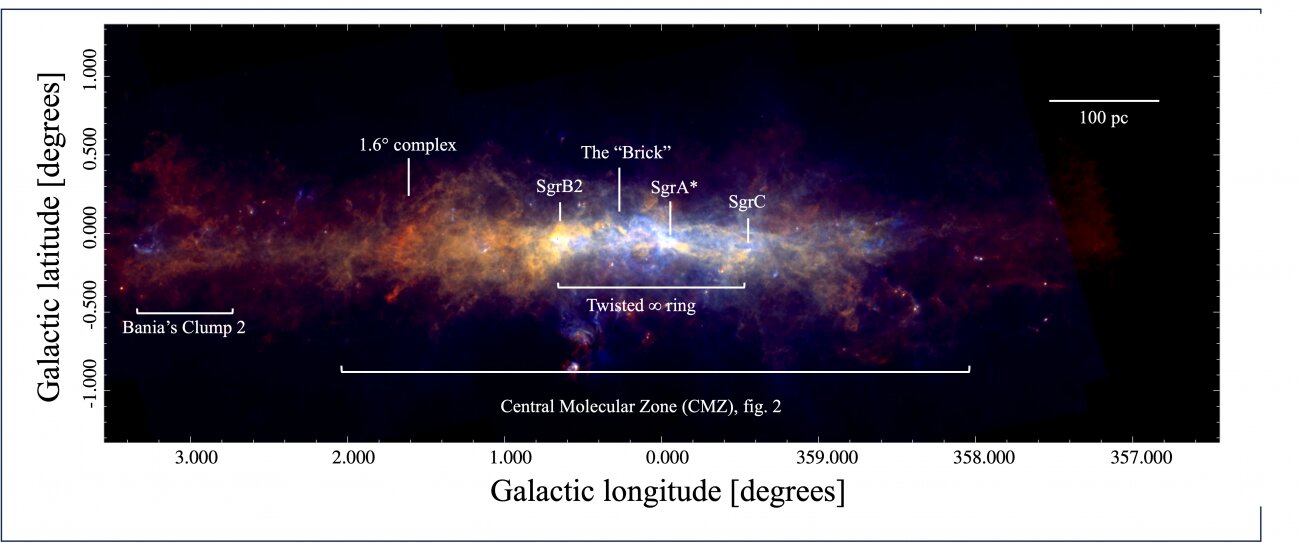
The CMZ is no ordinary patch of interstellar real estate. Stretching across about 500 light-years near the Milky Way’s core, it is a densely packed, high-pressure environment bursting with turbulent gas, shockwaves, and extreme gravitational forces. And somewhere deep in that tumultuous core lies Sagittarius A*—the Milky Way’s supermassive black hole, weighing in at over four million times the mass of our Sun.
To understand how the Milky Way breathes, feeds, and forms its stars, scientists must understand how the CMZ works. But there’s a catch: we can’t see it from above.
Unlike the stunning face-on images we have of distant spiral galaxies, we live inside the Milky Way, embedded in its flat galactic disk. That means every image we take of our own galaxy is from the side, distorted by perspective and cloaked by intervening gas and dust.
“We like to call the CMZ the way station of the galaxy,” says Battersby. “It’s a transitional zone where gas flows inward from the galactic disk along dusty lanes, collects in the CMZ, and either gets pulled into orbit around the center—or continues inward, feeding the black hole.”
The key to understanding this gas flow—and therefore the life cycle of the Milky Way itself—is reconstructing a top-down, three-dimensional map of the CMZ. That’s exactly what Battersby’s team set out to do.
The Challenge of Perspective: Reconstructing a 3D Galactic Center
Imagine trying to map a city by standing inside it, blindfolded, and only listening to the echoes of traffic and sirens. That’s essentially the problem astronomers face when trying to map the CMZ. We’re stuck viewing it edge-on, with vast clouds of gas and starlight blocking the view. Yet to understand whether gas is falling into the black hole, forming stars, or just drifting along, we need to know where these clouds are—behind, in front of, or orbiting the galactic center.
Battersby’s lab knew they had to build a detailed catalog of the CMZ—tracking every cloud, every clump, every signal they could detect. In the first two papers of the series, they did just that: combing through existing astronomical data to extract detailed measurements of gas clouds, including their positions, masses, velocities, temperatures, and more.
“We probably have hundreds of thousands of images of our galactic center, all in this sideways perspective,” says Battersby. “We can learn a lot from those images, but without knowing which clouds are moving in, which are orbiting, and which are drifting out, we can’t truly understand how the CMZ works.”
It’s like trying to understand a traffic jam with a still photograph. You can see the cars, but you can’t tell who’s going where or why.
Reading Shadows in the Light: Tracking Molecular Clouds
To overcome this, the team turned to an elegant solution: reading the shadows.
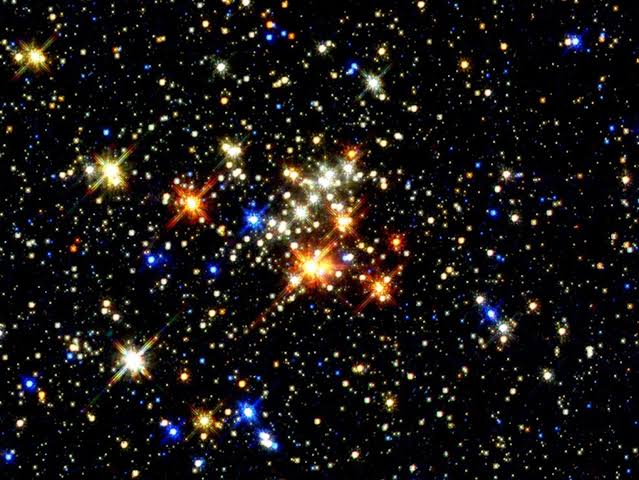
Within the CMZ are clouds of cool, dense gas—precisely the environments where stars are born. These molecular clouds are rare in the galactic center, where most gas is hot and diffuse. But when present, they leave distinct fingerprints depending on their location.
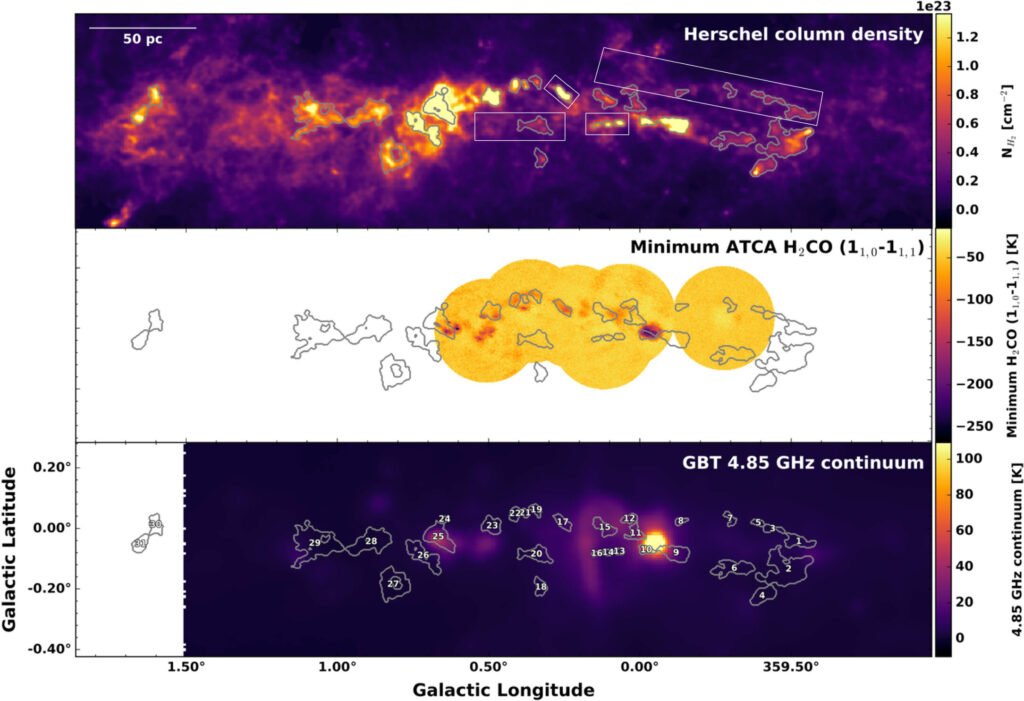
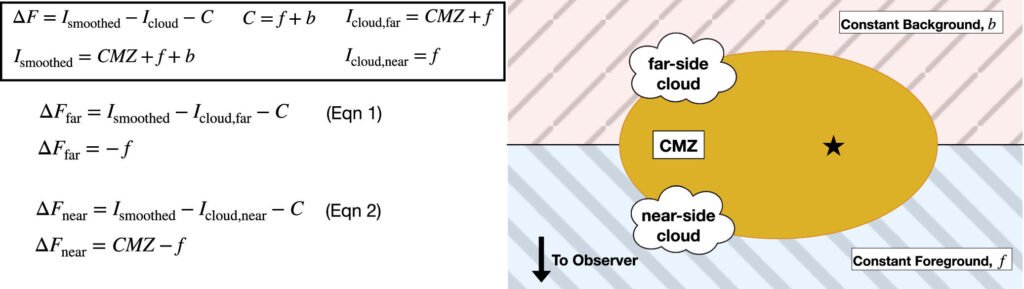
“If a dense gas cloud is in front of the galactic center,” explains Battersby, “it will block the bright background light. We see it as a shadow. But if it’s behind the galactic center, that light passes through unimpeded. So the key is measuring how much light is absorbed.”
In their third and fourth papers, the team pioneered two distinct methods for measuring this “shadow effect.” One technique, led by former postdoctoral fellow Daniel Walker, examined how radio waves are absorbed by the clouds. The other, spearheaded by current Ph.D. student Dani Lipman, used infrared observations to measure dust extinction—how much starlight the dust absorbs or scatters.
These techniques allow scientists to infer which clouds are closer to us and which are farther away—even when they appear side by side in a flat, 2D image. It’s a bit like watching a parade from above and knowing which floats are in front by the way their shadows fall.
A Dynamic, Complex, and Evolving Environment
As they built out their 3D model, Battersby’s team encountered a surprising level of complexity. The clouds weren’t just drifting lazily around the galactic center—they were swirling, crashing, collapsing, and occasionally falling toward Sagittarius A*.
In total, their data challenged the three dominant models of the CMZ that had existed prior. These earlier models offered competing visions: some depicted the clouds in closed elliptical orbits, others assumed spiral inflows, and a third postulated twisted “streams” of gas.
But none of the models fully matched the data.
“Paper three presented a new simple ellipse model that fit the data slightly better,” Battersby says. “But even that doesn’t capture the full complexity. We realized we needed a new, data-driven approach.”
That led to the creation of a new, continuously updated, best-fit model, which combines every available piece of observational data to reconstruct the most likely 3D positions of molecular clouds. The fifth paper, currently in development, will formally present this model—along with open-source code so that astronomers around the world can build on it.
Science in Motion: The Power of Open Collaboration
Lipman emphasizes the collaborative spirit behind this project. “Modern science is wonderfully collaborative,” she says. “Releasing our code is a huge part of engaging in the community. It offers resources to new scientists and students who are eager to join in answering these questions.”
That openness is already paying dividends. By making their tools public, the Milky Way Lab is enabling astronomers globally to test new hypotheses, refine the model with new data, and explore the CMZ’s role in galactic evolution.
It’s not just about the CMZ, either. Our galaxy is the only one close enough to study in this level of detail. Insights gained from our CMZ could help astronomers understand galactic centers throughout the universe—from quiet spirals like ours to the blazing hearts of active quasars.
Why the CMZ Matters: Cosmic Starbirth and Black Hole Physics
So why does the CMZ matter so much?
For one, it’s a crucible for star formation—albeit a puzzling one. While it contains vast amounts of gas, star formation rates in the CMZ are surprisingly low compared to what we’d expect. Something is suppressing the process. Is it turbulence? Magnetic fields? Feedback from past black hole activity?
By mapping where the molecular clouds are—and how they move—Battersby’s team can test these ideas directly.
“The CMZ provides ‘close’ access to extreme phenomena seen throughout the universe,” Battersby says. “That includes an accreting supermassive black hole and star formation in a highly turbulent environment.”
Understanding these processes is vital. After all, galaxies are the ecosystems of stars, and their centers are the engines. When black holes feed, they can spew radiation and jets that reshape galaxies. When gas flows in and stars are born, it changes the balance of mass and energy. Knowing how gas flows through the CMZ tells us how our galaxy evolved—and what might come next.
The Frontier of the Familiar
In some ways, the CMZ is the last unexplored frontier of the familiar. We gaze out into distant galaxies, capture the light of stars born billions of years ago, and peer at cosmic microwave background radiation from the dawn of time. But right here, in our own backyard, lies a region we’re only beginning to understand.
Thanks to infrared and radio telescopes, new algorithms, and the tireless work of scientists like Battersby, Walker, and Lipman, that veil is lifting. The shadows are becoming a map. The CMZ is emerging from the cosmic fog not just as a chaotic place, but as a system—one with rules, structures, and a role to play in our galactic story.
And it’s only the beginning.
As paper five nears release, and as new data from upcoming telescopes like the Square Kilometre Array (SKA) and the James Webb Space Telescope (JWST) roll in, the Milky Way Lab’s model will evolve. Each new observation, each new shadow measured, brings us closer to a complete map of the heart of the galaxy.
From our small corner of the Milky Way, we are building a grand perspective—one that stretches across time, space, and scale. It’s a story of motion, mystery, and discovery, and it begins not in a distant galaxy but here, where science meets curiosity, and where the night sky holds answers waiting to be revealed.
References: Cara Battersby et al, 3D CMZ. I. Central Molecular Zone Overview, The Astrophysical Journal (2025). DOI: 10.3847/1538-4357/adb5f0
Cara Battersby et al, 3D CMZ. II. Hierarchical Structure Analysis of the Central Molecular Zone, The Astrophysical Journal (2025). DOI: 10.3847/1538-4357/adb844
Daniel L. Walker et al, 3D CMZ. III. Constraining the 3D Structure of the Central Molecular Zone via Molecular Line Emission and Absorption, The Astrophysical Journal (2025). DOI: 10.3847/1538-4357/adb5ef
Dani Lipman et al, 3D CMZ. IV. Distinguishing Near versus Far Distances in the Galactic Center Using Spitzer and Herschel, The Astrophysical Journal (2025). DOI: 10.3847/1538-4357/adb5ee