For decades, scientists have watched the Arctic through layers of numbers, charts, and satellite images, trying to understand how fast it is changing and why. One of the most trusted guides in that effort has been the Intergovernmental Panel on Climate Change, whose reports shape how the world understands climate risk. Buried inside those reports is a simple but powerful measurement: autumn snow cover across the Northern Hemisphere.
Snow seems quiet, almost passive. It settles, it melts, it returns. Yet this white blanket plays an outsized role in Earth’s climate, acting like a mirror that sends energy back into space. For years, the data suggested that autumn snow cover was actually increasing. That idea sat uncomfortably alongside other signs of warming, but it remained part of the official picture.
Now, a new analysis from University of Toronto researchers reveals that this picture was distorted—not by intention, but by the tools used to observe it. The snow, it turns out, was not growing. It was disappearing.
The Bright Power of Snow
To understand why this matters, it helps to see snow not just as frozen water, but as a regulator of planetary temperature. Snow reflects about 80% of incoming energy back into space. By comparison, bare land and vegetation reflect less than 50%. That difference is enormous.
Aleksandra Elias Chereque, a Ph.D. student in physics at the University of Toronto, explains that snow cover acts as a feedback mechanism within the climate system. This process is known as the snow-albedo effect, with albedo meaning reflectivity. When snow is present, it keeps temperatures lower by reflecting energy away. When snow disappears, darker surfaces absorb more heat.
That extra absorbed energy doesn’t stay put. It accelerates warming, which leads to even more snow loss. This self-reinforcing loop is one of the drivers of Arctic amplification, the phenomenon where the Arctic warms faster than much of the rest of the planet. It helps explain why heating in the Arctic is so pronounced and so alarming.
Because snow cover sits at the center of this process, tracking it accurately is essential. And that is where the story begins to unravel.
A Long Record Under Quiet Suspicion
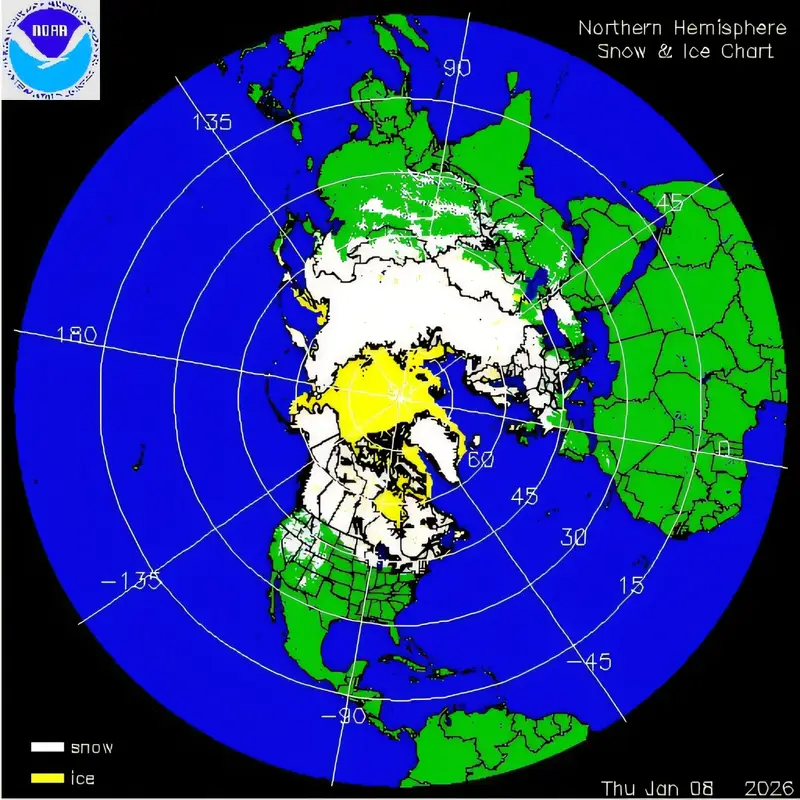
The U.S. National Oceanic and Atmospheric Administration has collected observations of Northern Hemisphere snow cover every year since the 1960s. These observations have been widely used, including in IPCC assessments, to track long-term trends.
According to the NOAA data, autumn snow cover increased by about 1.5 million square kilometers per decade. That is an area roughly 1.5 times the size of Ontario, a massive expansion that seemed to suggest more reflective white land over time.
But climate scientists have long felt uneasy about these numbers. The trends appeared dramatically inconsistent with other observations. The idea of increasing snow in a warming world raised questions that never fully went away. Many researchers argued the data should be treated with caution, but until now, the reasons behind the inconsistency were unclear.
When Better Eyes Create a False Picture
Elias Chereque and her collaborators decided to look deeper. Their study, published in Science Advances, carefully reanalyzed the NOAA snow cover data to understand how it was collected and how it changed over time.
What they found was not a climate mystery, but a measurement one.
Over the decades, the instruments and methods used to observe snow cover improved. Satellites became more sensitive. Data collection techniques evolved. These advances allowed observers to detect thin snow cover that earlier instruments might have missed.
Elias Chereque offers a vivid analogy. It is as if the satellite’s “eyeglasses” kept getting stronger. With each improved prescription, the satellite could see snow more clearly. But that clarity created an illusion. It looked as though there was more snow than before, not because snow had increased, but because the satellite had become better at spotting it.
The improved sensitivity was mistaken for a real-world trend.
When the researchers accounted for these changes in instrumentation and methodology, the story flipped. Instead of increasing, autumn snow cover was actually decreasing by about half a million square kilometers per decade, an area roughly half the size of Ontario.
The white blanket had been thinning all along.
Rewriting the Arctic’s Recent History
This correction does more than adjust a number on a graph. It reshapes how scientists understand recent Arctic change.
The revised trend confirms that snow cover is decreasing throughout the year, strengthening confidence in a result that aligns with broader evidence of warming. It also clarifies the role snow loss plays in amplifying Arctic heating.
Elias Chereque emphasizes that snow loss is influenced by anthropogenic warming, and that the loss itself creates more potential for warming through the snow-albedo feedback. By resolving the discrepancy in the data, researchers gain a clearer picture of how these forces interact.
The study was co-authored by Paul Kushner, a professor and chair in the department of physics at the University of Toronto, along with collaborators from the climate research division of Environment and Climate Change Canada. Together, they show not only that the earlier snow cover trend was wrong, but also why it was wrong.
That distinction is crucial.
Learning How to Trust the Numbers Again
Climate science depends on long-term data sets. They are the backbone of models that reconstruct past conditions and project future change. When a key data set is flawed, even unintentionally, it can ripple through decades of research.
By identifying the source of the error, Elias Chereque and her colleagues have done more than correct a record. They have shown how to use the NOAA data set properly, accounting for its evolving sensitivity.
This makes it possible to better estimate both past conditions and future trends. It also helps scientists evaluate whether climate models are accurately capturing the real world. When observations and models agree, confidence grows. When they don’t, understanding why becomes the next scientific challenge.
As Elias Chereque explains, developing tools like this allows researchers to better understand the climate system and make better predictions about what lies ahead.
Why This Research Matters
At first glance, the difference between an increase of 1.5 million square kilometers and a decrease of half a million square kilometers might seem like a technical detail, the kind of correction only specialists notice. In reality, it changes the narrative of Arctic change.
Snow cover is not just a passive indicator. It actively shapes how much energy Earth absorbs and how quickly warming accelerates in sensitive regions. Misreading its trend means misjudging one of the engines driving Arctic amplification.
This research matters because it restores clarity at a moment when clarity is urgently needed. It reinforces the understanding that snow loss is already underway, influenced by human-driven warming and feeding back into the climate system. It strengthens trust in the conclusion that the Arctic is heating faster than once thought, not slower.
Most importantly, it shows that science is capable of self-correction. By questioning long-standing assumptions, reexamining trusted data, and explaining errors with transparency, researchers sharpen the tools used to understand our planet.
In a warming world, seeing clearly matters. And sometimes, that clarity begins by realizing that the lenses we relied on needed adjustment.
Study Details
Aleksandra Elias Chereque et al, Determining the cause of inconsistent onset-season trends in the Northern Hemisphere snow cover extent record, Science Advances (2025). DOI: 10.1126/sciadv.adv7926