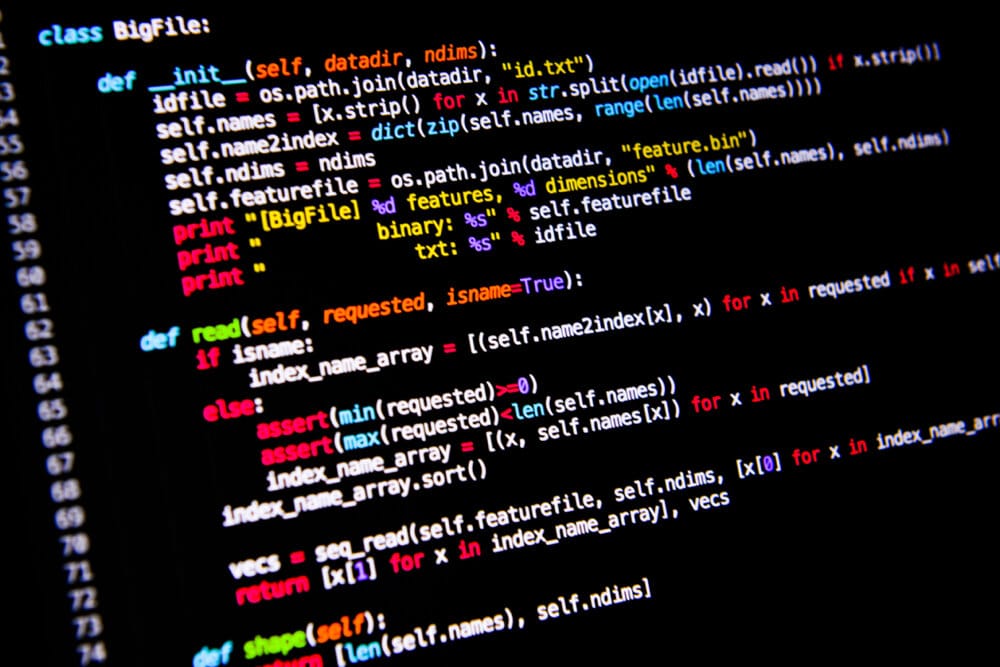
In the world of data science, a revolution has been quietly unfolding over the last two decades. This revolution is not marked by grand declarations or global conferences, but by the way millions of analysts, engineers, and researchers reach for a particular tool when facing mountains of messy data. That tool is Python.
Python did not begin life as the titan of data science. When Guido van Rossum released it in the early 1990s, it was meant to be a general-purpose programming language: readable, elegant, and easy for humans to write. It was a language where indentation mattered, where code could be understood like a conversation, and where simplicity was a design principle rather than an accident.
Over time, however, Python found itself adopted by scientists, statisticians, and business analysts for a simple reason: it gets out of your way and lets you think. In data science, where the problems are complex and the datasets enormous, this quality is priceless. Python doesn’t force analysts to wrestle with syntax or arcane rules; it allows them to focus on the real task — making sense of the data.
Yet Python alone is only the canvas. The vibrant strokes of color — the tools that give it the power to process, visualize, and model data — come from its libraries. These libraries are not mere code packages; they are the distilled efforts of countless developers, researchers, and data enthusiasts who have poured their expertise into reusable forms.
In the same way that a painter has brushes, oils, and pigments, the Python data scientist has a set of essential libraries. Knowing these libraries is like knowing the instruments in an orchestra: each has its role, its strengths, and its unique sound in the symphony of analysis.
The Beating Heart of Data Manipulation
If data is the lifeblood of modern analytics, then data manipulation is its circulation system. Before an analyst can model data, visualize it, or draw conclusions, they must first clean, reshape, and organize it into a form that makes sense.
In Python, this work revolves around pandas — the library that changed everything. Created by Wes McKinney in 2008, pandas brought something revolutionary to Python: a DataFrame, an object that allows analysts to store and manipulate tabular data in memory with ease. Before pandas, data analysts in Python often struggled with raw lists, dictionaries, or NumPy arrays that lacked intuitive structure for labeled data.
With pandas, the analyst can read a CSV file, merge datasets, filter rows, fill missing values, and compute summary statistics all in a few lines of readable code. The power here is not just in the functions, but in the philosophy: pandas treats data as something to be explored interactively, reshaped on demand, and combined in ways that mimic the operations analysts already know from tools like Excel — only faster, more precise, and vastly more scalable.
Working with pandas often feels like sculpting: you start with a rough, messy block of data and chip away at it, transform it, until the hidden patterns begin to reveal themselves. Whether the task is preparing financial transaction records for fraud detection, cleaning up clinical trial results, or merging social media datasets for sentiment analysis, pandas provides the foundation.
The Bedrock of Numerical Computation
Beneath pandas lies another giant: NumPy. If pandas is the expressive, friendly face of Python data manipulation, NumPy is the unshakable mathematical core beneath it.
NumPy, short for Numerical Python, brings high-performance multidimensional arrays to Python. These arrays are not like Python’s built-in lists; they are dense, homogeneous, and implemented in C for speed. For a data scientist, this means calculations that would take minutes in plain Python can be performed in seconds — or less — with NumPy.
But speed is only part of the story. NumPy gives analysts the tools to perform vectorized operations, linear algebra, Fourier transforms, and random number generation. In machine learning, scientific simulations, and image processing, NumPy is everywhere — often invisibly, because so many other libraries, from pandas to scikit-learn, are built on top of it.
Think of NumPy as the mathematical engine under the hood of Python’s data science car. You might not always work with it directly — especially as a beginner — but every acceleration, every smooth turn, every responsive maneuver is powered by it.
The Visual Storyteller
Data, in its raw form, is often incomprehensible. Endless rows and columns of numbers can hide the most important insights from even the sharpest analyst. This is why visualization is not a luxury in data science — it is a necessity.
In Python, the story of visualization starts with Matplotlib. Created by John Hunter in the early 2000s, Matplotlib was designed to bring MATLAB-style plotting to Python. It can produce anything from simple line graphs to complex 3D plots, all customizable down to the tiniest detail.
Matplotlib is the workhorse: when you need full control over your figure — the axes, the ticks, the labels, the colors — it delivers. But its syntax can feel verbose, and its plots, while accurate, sometimes lack immediate aesthetic appeal. This is where other libraries step in to build on its shoulders.
One such library is Seaborn, developed by Michael Waskom. Seaborn takes the raw power of Matplotlib and layers on elegance, default styles, and statistical visualizations that are ready to impress. In a single line, you can create a violin plot showing the distribution of exam scores by gender, or a heatmap revealing correlations in a dataset.
Good visualization is like good storytelling: it takes the chaotic, unfiltered truth and gives it shape, pace, and focus. With Matplotlib and Seaborn, Python analysts can tell stories that persuade, inform, and inspire action — whether to guide a business strategy, influence public policy, or simply illuminate an overlooked pattern.
The Engine of Machine Learning
In recent years, data science has become inseparable from machine learning — the art and science of teaching computers to learn from data and make predictions. Here, one library has emerged as the standard bearer: scikit-learn.
Born from the SciPy ecosystem, scikit-learn provides a coherent, user-friendly interface to a vast range of machine learning algorithms: linear regression, decision trees, support vector machines, k-means clustering, and more. It also includes the tools for preprocessing data, tuning models, and validating results.
What makes scikit-learn exceptional is its consistency. Whether you’re training a logistic regression model or a random forest, the process follows the same pattern: import, instantiate, fit, predict. This uniformity lowers the barrier to experimentation, allowing analysts to try multiple approaches quickly and compare their performance.
Machine learning is often portrayed in popular media as a mysterious black box. In truth, the principles are rooted in mathematics and statistics, and scikit-learn acts as the translator between those theories and practical, working code. For the analyst, it opens the door to predictive modeling, anomaly detection, and data-driven decision-making at scale.
Scaling to the World’s Data
Not all data fits comfortably into a single computer’s memory. In fact, in an era of global-scale sensors, social media streams, and transaction logs, most datasets of real strategic value are massive. This is where Dask comes into play.
Dask extends the familiar interfaces of pandas and NumPy to handle data that is larger than memory, breaking computations into chunks that can be distributed across multiple cores or even multiple machines. The beauty is that an analyst who knows pandas can often switch to Dask with only minor adjustments to their code — yet suddenly be operating at a scale that would have been impossible otherwise.
The rise of big data has forced data scientists to think not only about analysis, but about systems. Dask is part of that bridge, letting analysts scale up without abandoning the ecosystem they know.
Deep Learning’s Gateway
While scikit-learn handles a wide range of traditional machine learning algorithms, deep learning — with its neural networks and vast data requirements — calls for specialized tools. In Python, two dominant players have emerged: TensorFlow and PyTorch.
TensorFlow, developed by Google Brain, was the early heavyweight, bringing industrial-strength tools for building and deploying neural networks at scale. PyTorch, developed by Facebook’s AI Research lab, offered a more intuitive, Pythonic approach, winning over researchers with its dynamic computation graphs and ease of experimentation.
Both libraries are capable of powering world-class AI applications: image recognition systems that can diagnose medical conditions, natural language models that can translate across languages, reinforcement learning agents that can play — and win — at complex games. For the data analyst venturing into deep learning, these libraries are both a challenge and an opportunity: a step into a domain where the patterns are subtler, the models deeper, and the stakes often higher.
The Unsung Heroes
Not every essential library makes headlines. Some work quietly in the background, handling tasks that are less glamorous but equally vital. Statsmodels is one such library, offering deep statistical modeling capabilities that complement scikit-learn’s machine learning focus. Econometrics, time series analysis, and hypothesis testing find a natural home here.
Similarly, OpenCV brings computer vision tools to Python, enabling analysts to process and interpret images and video. NLTK and spaCy equip Python with natural language processing abilities, from tokenizing text to extracting entities.
These specialized libraries reflect an important truth: data science is not one discipline but a crossroads of many. The libraries you master depend on the kinds of problems you aim to solve — and Python’s ecosystem ensures that whatever your niche, there is a tool to help.
A Living Ecosystem
Perhaps the most remarkable thing about Python for data science is not any single library, but the ecosystem as a whole. These libraries do not exist in isolation; they interoperate, share data structures, and build on one another’s strengths. Pandas uses NumPy arrays under the hood; Seaborn works seamlessly with pandas DataFrames; scikit-learn can take NumPy arrays, pandas DataFrames, or even outputs from Dask as inputs to its models.
This interconnectedness means that learning Python for data science is not like memorizing disconnected facts. It’s like entering a city where every street connects, every building has a purpose, and every citizen speaks a shared language. The more you explore, the more you see the patterns that tie it all together.
The Human Side of the Code
It is easy to get lost in the technical details and forget that behind every library there are people — open-source contributors, maintainers, documentation writers, educators. Many of these libraries began as side projects, created by individuals trying to solve a problem in their own research or work. Over time, they attracted communities, grew in scope, and became essential to industries and disciplines far beyond what their creators might have imagined.
For an analyst learning these libraries, this is a reminder that data science is not a solitary pursuit. It is a collaborative effort, built on shared tools, shared challenges, and shared curiosity. When you import pandas or NumPy, you are stepping into a tradition of collective problem-solving that spans the globe.
Beyond the Tools
Libraries are tools, but tools alone do not make a craftsman. The true power of Python in data science comes when these libraries are used with critical thinking, domain expertise, and a relentless curiosity about the world. The best analysts are those who not only know which library to use, but understand why they are using it, what assumptions underlie its methods, and what stories the data might be hiding.
In the end, Python’s role in data science is not just to enable computation. It is to enable exploration. It is to lower the barriers between a question and an answer, between an idea and a test, between data and insight.
For every analyst who has stared at a dataset and wondered what truths it holds, Python offers a way forward — a way to transform raw numbers into knowledge, and knowledge into action. And in that transformation, there is something quietly profound: a reminder that in the digital age, the language we use to speak to machines is also the language we use to better understand ourselves.


