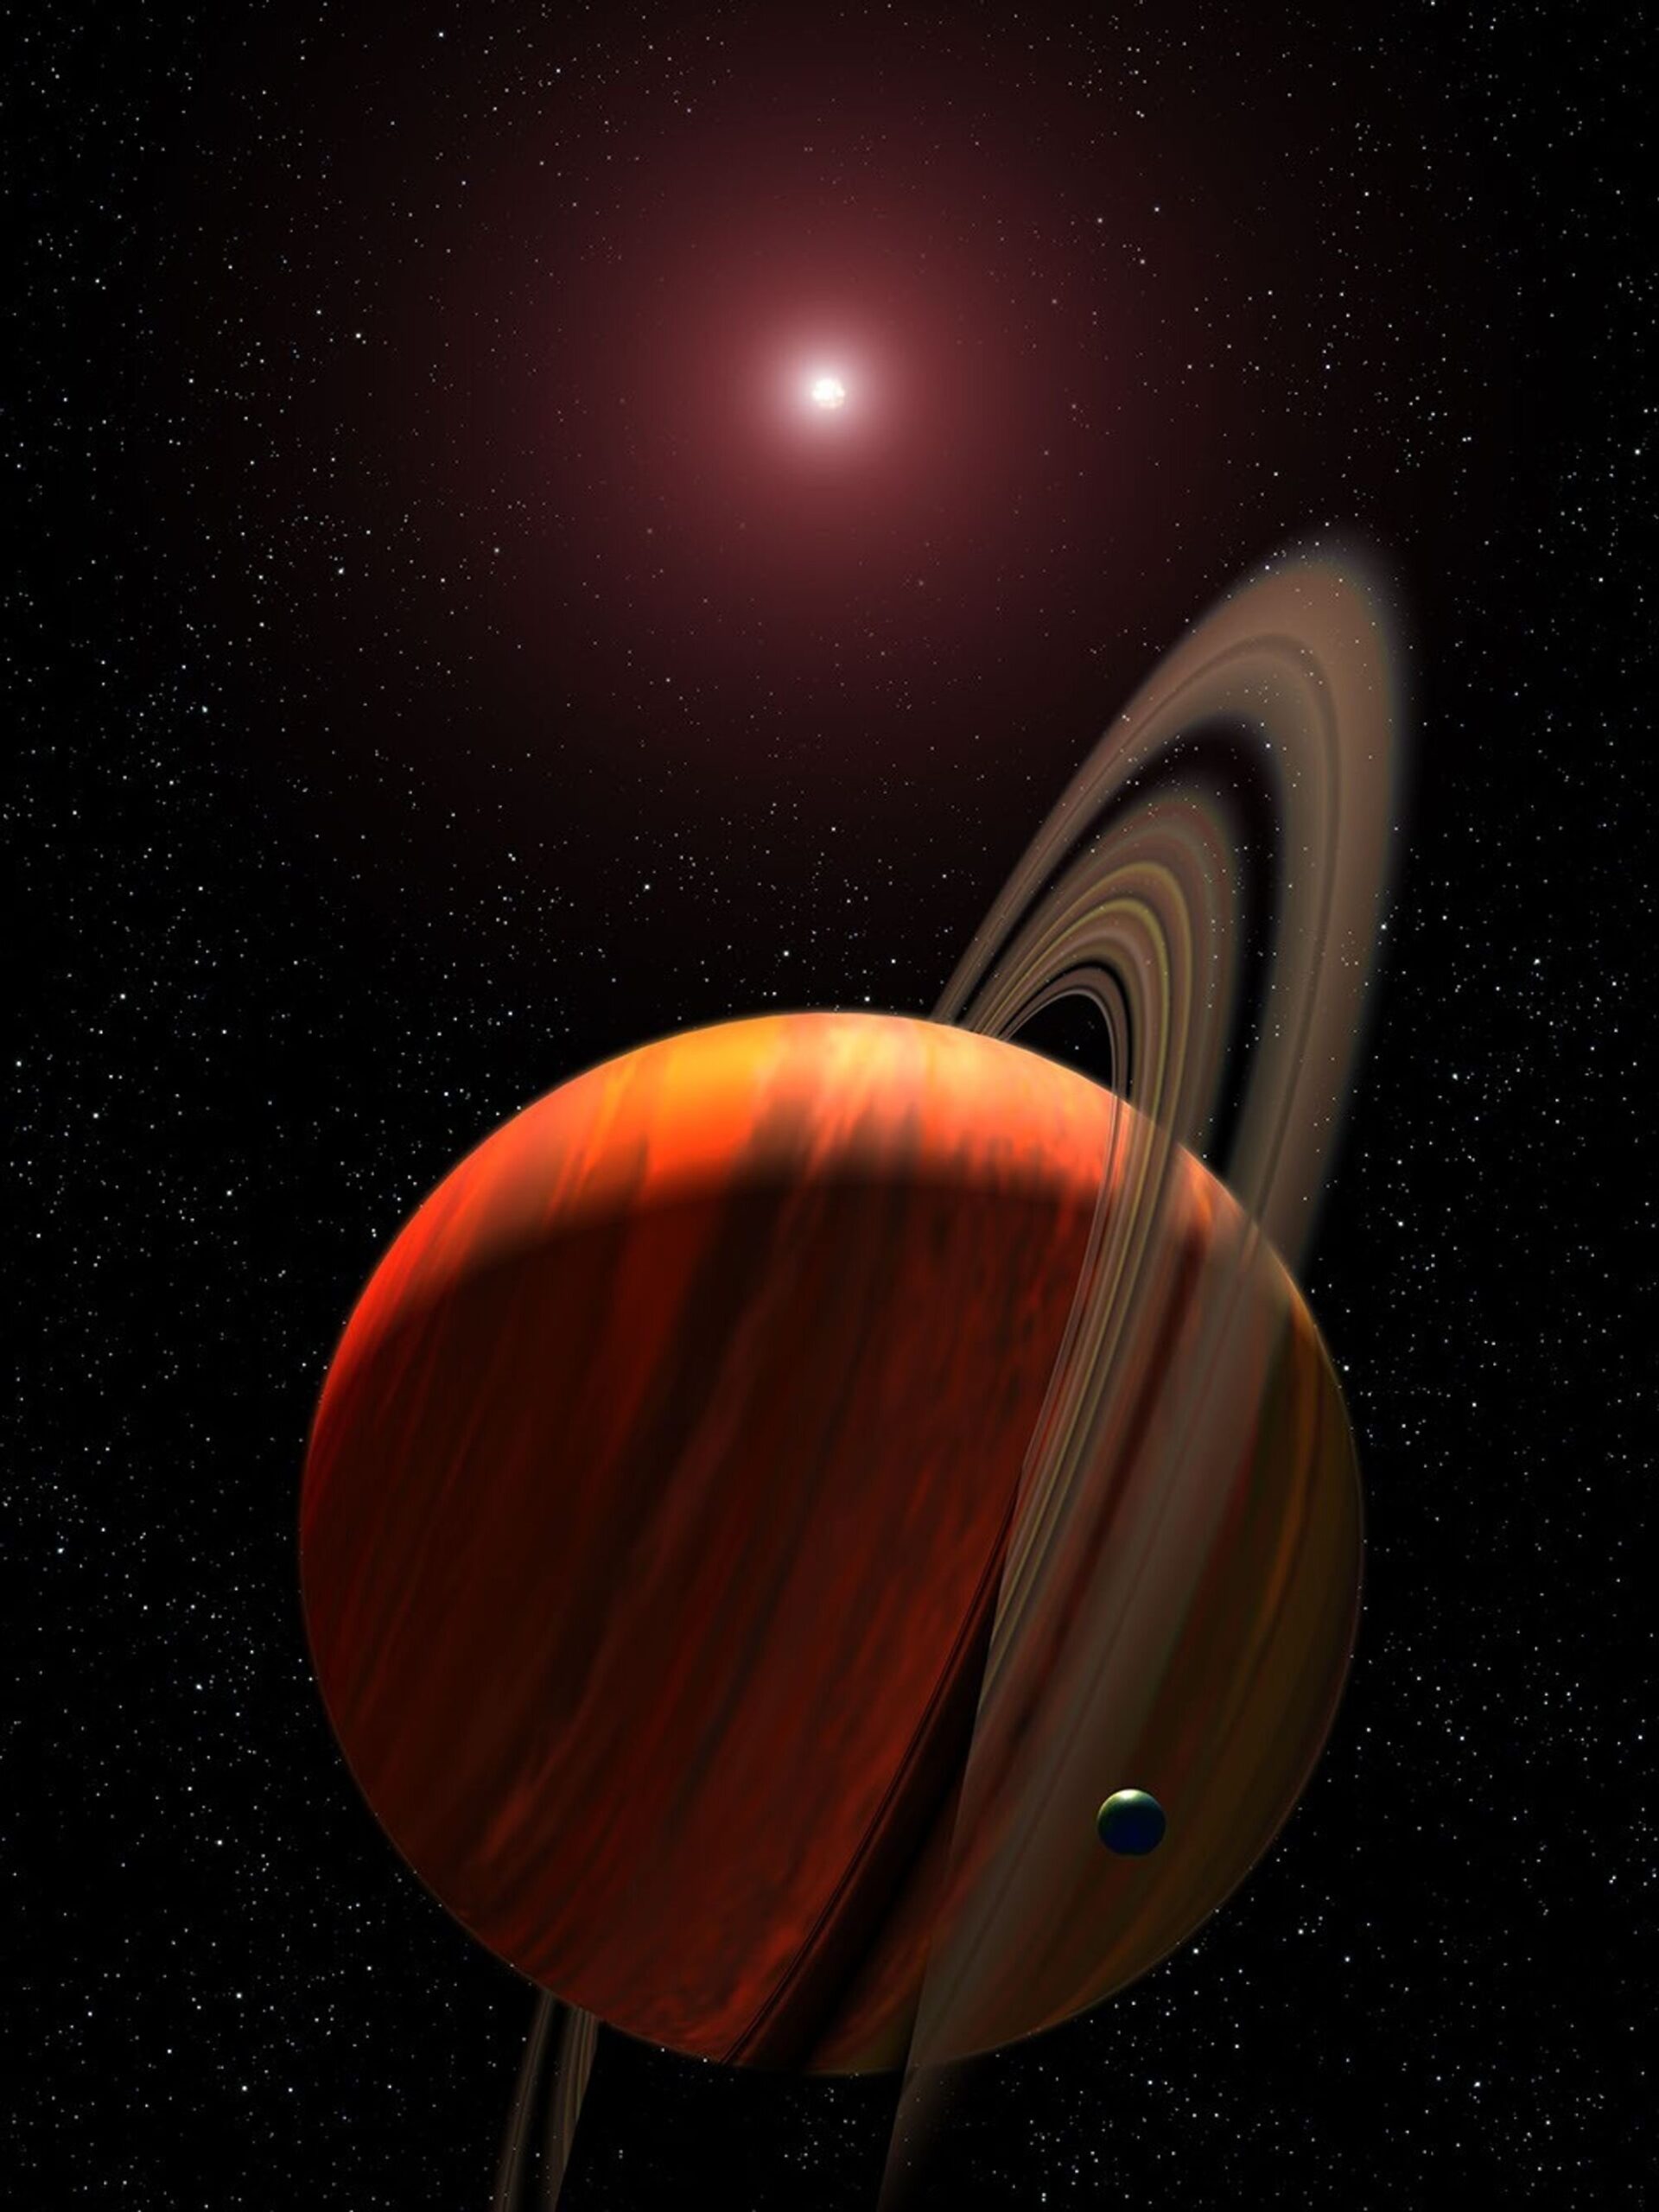
Circling a small red star, the Saturn-mass planet HATS-6 b has produced an atmospheric spectrum that does not fit its expected temperature. Observations from NASA’s James Webb Space Telescope point to an atmosphere containing water, methane and ammonia, while repeated analyses put its retrieved temperature nearly 200 kelvins below the value expected from the planet’s orbit and stellar irradiation. The same data also contain an unexplained feature around 3 microns that may be related to additional chemistry, haze, stellar activity or differences between the planet’s two observed limbs.
HATS-6 b is an unusual member of the population of giant planets orbiting M-dwarf stars. It has about 0.3 times Jupiter’s mass but roughly Jupiter’s radius, giving it a low density of about 0.39 grams per cubic centimeter. It circles an M1V star with about 0.6 times the Sun’s mass once every 3.3 days.
The planet was expected to have an equilibrium temperature of about 713 kelvins based on its orbital configuration. That estimate assumes efficient redistribution of heat around the planet and no reflection of incoming stellar energy, corresponding to a Bond albedo of zero.
The new observations instead point to a substantially lower atmospheric temperature.
The study is part of a James Webb Space Telescope survey designed to characterize giant exoplanets around M-dwarf stars and compare their atmospheric and bulk properties with giant planets orbiting more Sun-like stars. HATS-6 b was the second target examined in that survey.
The researchers observed two transits, on January 15 and January 21, 2024, using JWST’s Near Infrared Spectrograph, or NIRSpec, in its PRISM mode. Each observation lasted about 5.6 hours and covered wavelengths from 0.6 to 5.3 microns.
As the planet passed in front of its star, some wavelengths of starlight were absorbed by gases in its atmosphere. Measuring those wavelength-dependent changes in the apparent size of the planet allowed the researchers to construct a transmission spectrum.
They independently processed the observations with two major reduction pipelines, ExoTiC-JEDI and Eureka!, and also tested different choices involving spectral binning, stellar limb darkening, spots and possible asymmetries between the planet’s two limbs.
The resulting spectra generally agreed within about 2 sigma despite those different approaches.
Water, methane and ammonia stand out
The atmospheric analysis used several stages rather than relying on a single model. The researchers first generated forward models assuming chemical equilibrium and then models that allowed chemical reactions to move the atmosphere away from equilibrium. They also investigated possible clouds and aerosols before performing free-chemistry atmospheric retrievals.
The chemical-equilibrium models consistently pushed toward very low atmospheric metallicity and low carbon-to-oxygen ratios. They also failed to reproduce several features in the observed spectrum.
A particularly persistent result was the low retrieved temperature.
Three independent chemical-equilibrium retrieval frameworks produced temperatures of roughly 300 to 450 K, substantially below the approximately 710–740 K expected from the planet’s irradiation. Forcing the retrieval toward the expected 700 K temperature produced poorer fits and pushed other atmospheric properties toward extreme values.
The researchers therefore expanded the analysis to free-chemistry models, allowing individual molecular abundances to vary rather than requiring them to follow chemical equilibrium.
Their final model included a gray cloud deck and a parameterized haze.
For the combined observations, the retrieved temperature was about 514 K, with an uncertainty of roughly 30–40 K. The value varied between the two visits, with about 499 K for the first and 568 K for the second, but remained well below the expected equilibrium temperature.
The same broad result survived changes in the data reduction and retrieval software.
The strongest molecular constraints were on water, methane and ammonia. The retrieved volume mixing ratios were approximately:
- Water: log(H₂O) = −4.88, with uncertainties of about 0.24–0.25 dex
- Methane: log(CH₄) = −5.38, with uncertainties of about 0.18–0.19 dex
- Ammonia: log(NH₃) = −6.03, with uncertainties of about 0.18–0.19 dex
The analysis also found evidence for carbon dioxide at log(CO₂) = −7.59, with larger uncertainties.
A leave-one-out Bayesian test provided strong statistical support for the three best-constrained molecules. Removing water changed the Bayesian evidence by 22.61 in natural-log units, methane by 79.24 and ammonia by 11.93. Carbon dioxide produced a smaller change of 4.24.
The authors describe HATS-6 b’s ammonia detection as only the second ammonia detection obtained through transmission spectroscopy.
The temperature refuses to rise
The low temperature is one of the most persistent features of the analysis.
It appeared in equilibrium and free-chemistry retrievals, remained after the researchers considered clouds and haze, and persisted when they changed data-reduction methods and retrieval codes. More flexible temperature-pressure profiles also did not eliminate it.
The researchers therefore considered what the result would imply if the planet efficiently redistributed heat.
Under that assumption, the retrieved temperature corresponds to a Bond albedo of about 0.71. In other words, the planet would need to reflect a substantial fraction of the stellar energy it receives rather than absorbing it.
The authors interpret this as possible evidence for reflective clouds or haze, although they stress that a Bond albedo cannot by itself distinguish between those possibilities.
Their retrievals also generally preferred models containing clouds or haze over clear-atmosphere models.
The study does not establish that clouds or haze are responsible for the low temperature. Other effects associated with the star or with the planet’s atmospheric structure could contribute to the discrepancy.
HATS-6 is an M dwarf, and its stellar surface can complicate transmission spectroscopy. Dark spots, limb darkening and other forms of stellar heterogeneity can alter the apparent depth of a planetary transit in a wavelength-dependent way.
The researchers found evidence for spot crossings in the white-light curves, including a model with one spot for the first visit and three for the second. But when they modeled the spectra themselves, they found no notable chromatic difference between spotted and nonspotted fits.
They also tested possible asymmetries between the planet’s morning and evening limbs. Those fits produced highly correlated limb spectra, making the apparent differences unreliable as measurements of physical atmospheric structure. The researchers therefore adopted the simpler model without limb asymmetries.
They nevertheless caution that current models of M-dwarf stellar surfaces may not capture all of the relevant stellar activity. Better stellar models could help separate stellar effects from atmospheric signals.
A planet with little atmospheric metal but a metal-rich interior
The atmospheric retrievals also point to a low metallicity.
The final model gives log[M/H] = −1.99 ± 0.2 relative to the solar abundance scale. The carbon-to-oxygen ratio is also subsolar, with log(C/O) = −0.46 ± 0.2, although the authors emphasize that C/O is less consistently constrained than metallicity across their retrievals.
The low atmospheric metallicity was much more stable across the model tests than the C/O ratio.
The researchers then examined the planet’s interior using GASTLI, a one-dimensional interior and thermal-evolution model. This analysis combined the planet’s measured mass and radius with the atmospheric metallicity and estimates of its intrinsic temperature.
A separate calculation showed that a pure hydrogen-helium planet with no heavy-element core would not reach HATS-6 b’s observed radius under standard cooling models, even when the assumed system age was allowed to range from 1 to 10 billion years. The authors therefore infer that the planet is inflated relative to those standard models and requires an additional energy source that is not included in them.
They explored two intrinsic temperatures, 50 K and 300 K, because the atmospheric forward models favored about 50 K while the hotter model better reproduced the observed radius.
For the 50 K case, the interior modeling gives a heavy-element fraction of about 0.14, with uncertainties of roughly 0.08–0.09. For the 300 K case, the value is about 0.12, with uncertainties of roughly 0.07–0.08.
The atmospheric metallicity corresponds to a heavy-element fraction of roughly 10⁻⁴.
That creates a difference of about three orders of magnitude between the inferred bulk and atmospheric metallicities.
The authors interpret this as strong evidence that HATS-6 b is not fully mixed, meaning the composition measured high in its atmosphere is not representative of the planet’s bulk composition.
They caution that the absolute bulk-metallicity estimate depends on uncertainties in giant-planet evolution models, including equations of state, opacities and assumptions about the planet’s internal structure. The models also do not include some possible structures such as dilute cores or inverted heavy-element gradients.
Those uncertainties affect the precise inferred bulk composition, but the authors conclude that they do not erase the large contrast between the atmospheric and bulk metallicities.
Something extra appears near 3 microns
The most unresolved part of the spectrum lies around 3 microns.
During the initial retrievals, the researchers noticed an absorption feature extending from roughly 3 to 3.5 microns that could not be adequately reproduced by methane alone. Wavelength-cutoff tests showed that this region was also driving some of the unusually low retrieved temperatures.
When a broad set of molecules was allowed to vary freely, the retrieval repeatedly assigned the excess to ethene, or C₂H₄.
That result was difficult to reconcile with the atmospheric chemistry expected from the study’s forward models. Even when chemical disequilibrium and vertical mixing were included, those models did not predict enough C₂H₄ or other complex aliphatic hydrocarbons to account for the retrieved abundance.
Adding C₂H₄ to the final model produced a slight improvement in the fit. The coadded data gave a retrieved abundance of about log(C₂H₄) = −6.20, but the Bayesian evidence did not provide a strong constraint. The improvement was also more pronounced in the second visit than the first.
The researchers tested whether methane alone could account for the feature. A retrieval containing only water and methane still produced a low temperature of about 350 K and a poorer fit around 3 microns than the model that included C₂H₄.
They then tested hydrogen cyanide, or HCN, as another possible explanation.
The HCN model also reduced the discrepancy around 3 microns. It produced a retrieved abundance of log(HCN) = −5.71, with a maximum detection significance of about 3.6 sigma. But HCN introduced another mismatch around 3.8–4.0 microns.
Neither test settles what causes the feature.
The authors emphasize that the 3-micron region contains overlapping molecular features, making it difficult to distinguish among hydrocarbons and other possible contributors with the available spectrum. The C₂H₄ and HCN fits are therefore treated as possible explanations rather than detections of those molecules.
The authors ultimately do not draw a conclusion about the presence of the excess feature itself.
The two visits are not identical
The feature’s strength changes between the two observations.
The researchers found small differences between the visits across all three data-reduction methods, generally within about 2 sigma. The differences were particularly noticeable around 2.8–3.5 microns and near 4.2 microns.
Several explanations remain possible.
The stellar surface could have changed between observations. The planet’s atmosphere could also vary. Alternatively, the difference could reflect the relative precision of the two datasets.
The researchers also discuss previous global circulation models of HATS-6 b, which predicted differences between the planet’s morning and evening terminators. Those models found variations in cloud-deck height and methane and water features at the level of roughly 100–200 parts per million.
They also predicted a possible methane enhancement on the evening terminator around the 3-micron region.
Such an atmospheric difference could potentially contribute to the observed excess, but the current observations cannot establish that explanation. The limb-asymmetry analysis is itself limited by degeneracies with stellar limb darkening.
Clouds and haze remain plausible, but unconfirmed
The researchers tested condensate clouds with the virga modeling framework. Under their assumed conditions, zinc sulfide was the only condensate whose condensation curve crossed the relevant temperature range within the pressures considered.
But the modeled zinc sulfide cloud tops occurred at pressures much deeper than those probed by the transmission spectrum. The resulting cloud treatment produced no measurable difference in the modeled spectrum.
That does not rule out all clouds.
The authors note that the cloud calculation was limited by the available condensate species, assumptions about spherical particles and the 0.6–5.3 micron wavelength range of the observations.
Their atmospheric retrievals nevertheless favored models containing clouds and haze, while previous circulation models of HATS-6 b have also predicted substantial cloud coverage and complex cloud structures.
The low retrieved temperature provides another reason the authors consider aerosols physically plausible. But the observations do not directly establish which aerosol species, if any, are responsible.
The star remains part of the puzzle
The study’s extensive tests were designed in part to determine whether the unexpected atmospheric results could be artifacts of data processing or stellar contamination.
The researchers used two independent reduction pipelines and several retrieval frameworks. The abundances of water, methane and ammonia remained broadly consistent between the approaches.
They also tested a model that explicitly included a transit light-source effect from stellar spots. That model had high statistical evidence, but it required spot temperatures of about 2,395 K and 2,679 K for the two visits.
The researchers had independently estimated spot temperatures of about 3,130 K and 3,761 K from the white-light curves. The much cooler temperatures required by the retrieval were considered physically problematic for the M-dwarf star.
For that reason, the researchers selected the cloud-plus-haze model rather than the cloud-plus-stellar-contamination model as their final model.
They do not rule out stellar contamination. Instead, they conclude that the available data do not provide enough information to separate all possible stellar and atmospheric effects with confidence.
The study also found that changing the limb-darkening prescription affected the extracted spectrum most strongly at wavelengths shorter than 3 microns. None of the tested stellar atmosphere grids fully captured the complexity seen in the observations, leading the researchers to use freely fitted limb-darkening parameters in their final reduction.
These limitations are particularly relevant to the unexplained 3-micron region and to the differences between the two visits.
The resulting picture is therefore more specific than simply saying that HATS-6 b has an unusual atmosphere. The observations robustly support water, methane and ammonia, and they consistently point to a low atmospheric metallicity and a lower-than-expected retrieved equilibrium temperature. The planet’s inferred bulk composition is much richer in heavy elements than its atmosphere. But the origin of the low temperature and the extra absorption around 3 microns remains unresolved.
The authors conclude that additional observations at wavelengths where hydrocarbon features are less degenerate could help distinguish among the possible explanations for the 3-micron region. They also emphasize the need for improved models of M-dwarf stellar environments and retrieval methods capable of jointly analyzing multiple visits while accounting for changing stellar and atmospheric conditions.
The study was published in The Astronomical Journal.