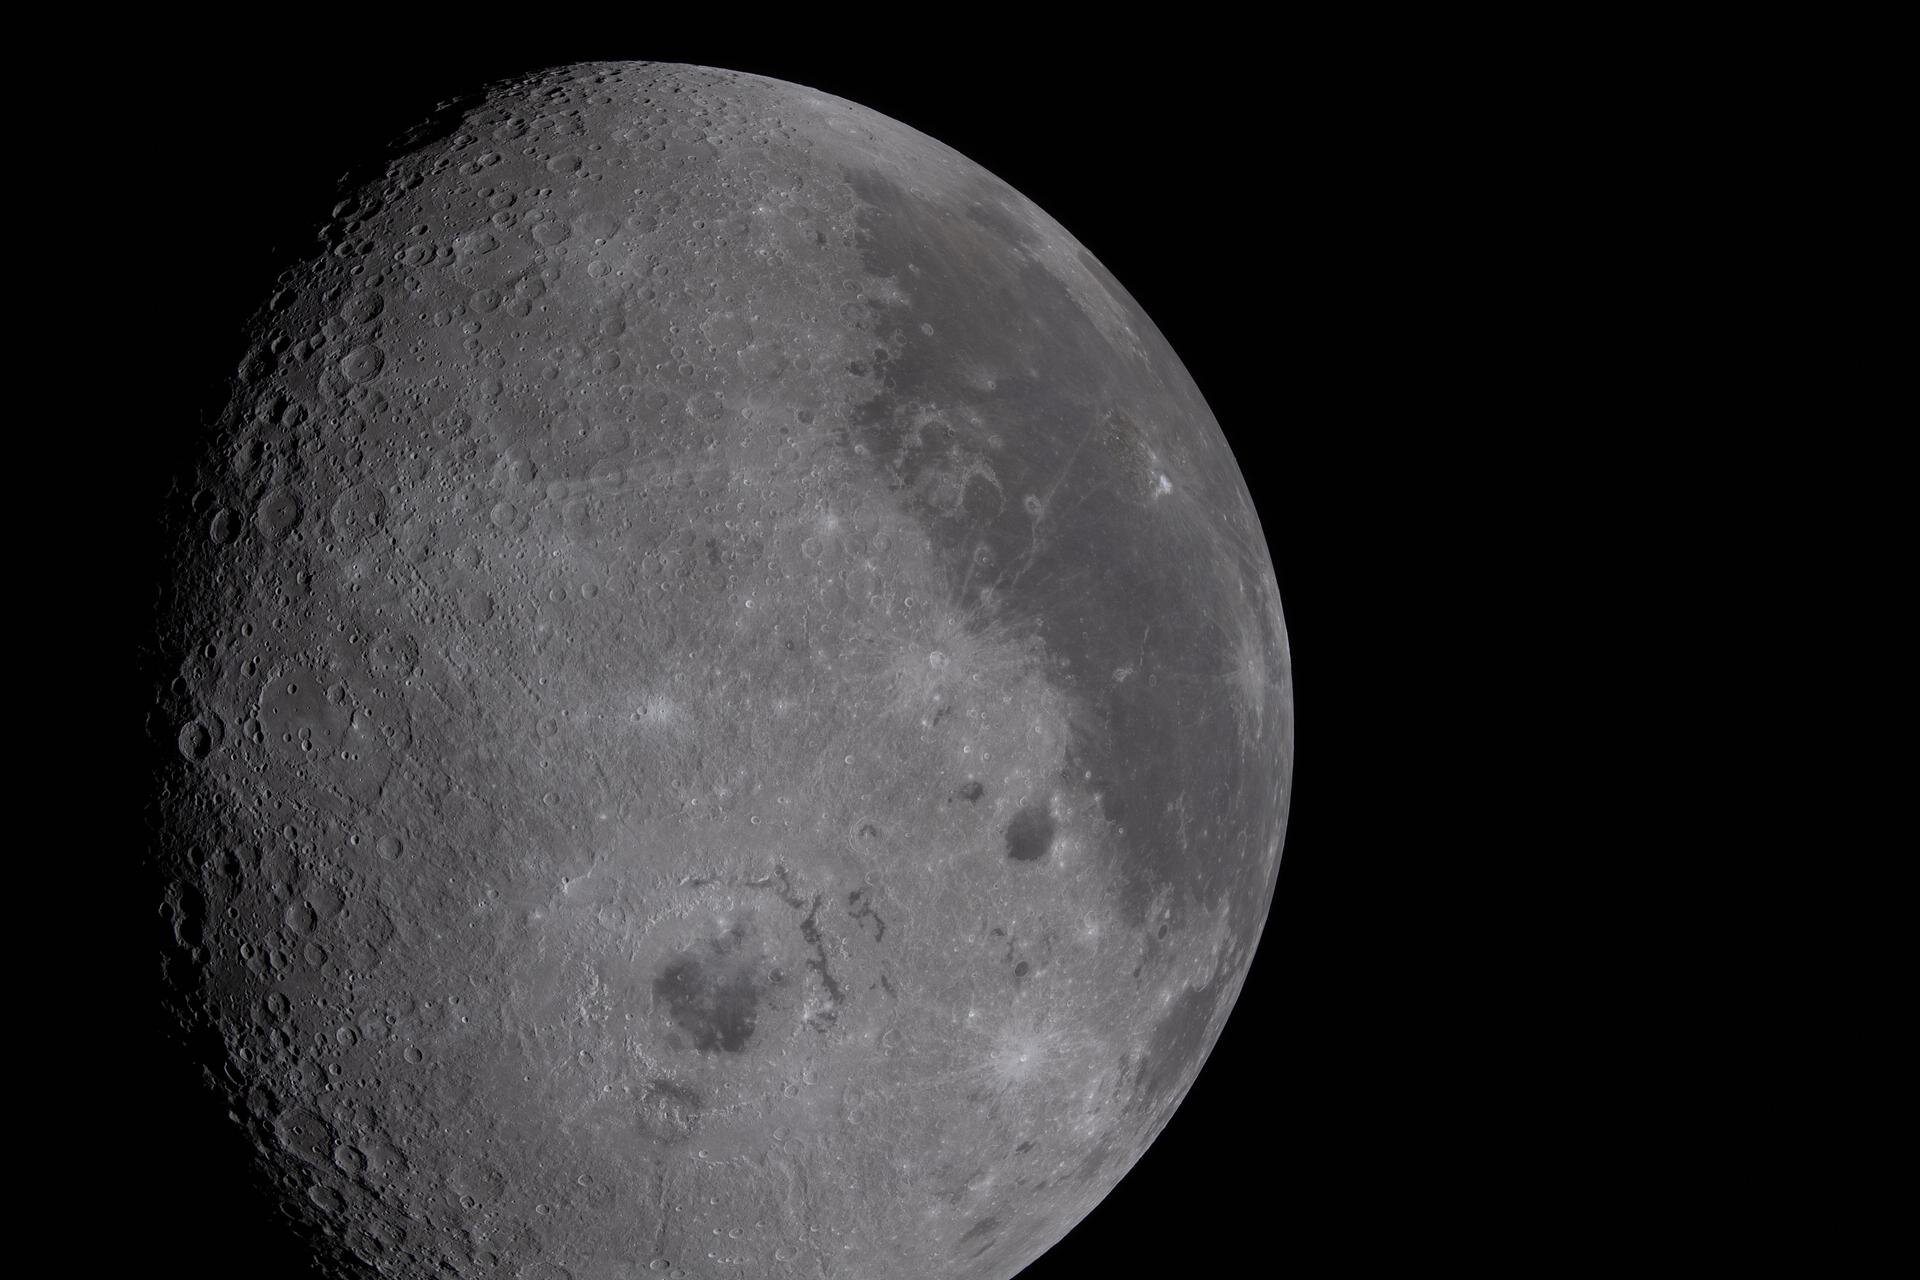
Deep beneath the permanently shadowed craters near the Moon’s south pole, invisible pockets of frozen water may leave behind a surprisingly loud signature—not in light or radar, but in the way seismic waves race, scatter, and sometimes almost disappear as they pass through the lunar ground. By recreating icy lunar soil in the laboratory and modeling how those frozen deposits would behave underground, scientists have outlined a way future missions could search for buried ice without ever digging into the surface.
For decades, evidence has accumulated that water exists on the Moon, particularly around its south pole. Remote sensing has indicated that substantial quantities of water ice may be preserved within permanently shadowed regions, where sunlight never reaches and temperatures remain extremely low. More recent spectroscopic observations have suggested that lunar soil in some areas could contain between 100 and 400 milligrams of water per gram of regolith, far more than earlier estimates.
But one of the biggest unanswered questions has remained remarkably practical: where exactly is that ice, how much is there, and how is it distributed beneath the surface?
Those answers matter because future scientific expeditions and long-term lunar infrastructure will likely depend on local resources rather than transporting everything from Earth. Water can support human activities directly and can also provide hydrogen and oxygen, making buried ice one of the Moon’s most valuable natural resources.
Instead of relying only on remote sensing, the new research explores whether seismic methods—the same kinds of techniques commonly used on Earth to investigate the underground—could identify hidden lunar ice by listening to how vibrations travel through frozen soil.
Building a lunar underground in the laboratory
The researchers began with an essential question: how does ice actually change the physical behavior of lunar soil?
To answer it, they recreated icy lunar regolith using JSC-1A, a basaltic lunar soil simulant made from volcanic cinders. They measured how fast compressional (P) waves and shear (S) waves moved through both dry and frozen material using ultrasonic instruments.
Those measurements allowed the team to calculate the material’s bulk modulus, which describes resistance to compression, and its shear modulus, which describes resistance to deformation.
For fully frozen material, they measured a density of 2.103 grams per cubic centimeter, corresponding to a shear modulus of 7.16 gigapascals and a bulk modulus of 22.19 gigapascals.
For comparison, the dry reference material—based on Apollo 17 rock powder measurements under conditions similar to the laboratory experiments—had a density of 1.510 grams per cubic centimeter, with a much lower shear modulus of 0.84 gigapascals and a bulk modulus of 4.41 gigapascals.
Those differences illustrate how dramatically ice can stiffen lunar soil.
But simply knowing the properties of frozen and unfrozen material was not enough. The researchers also needed to understand how ice occupies the spaces between grains because that microscopic arrangement strongly influences how seismic waves travel.
Looking inside frozen lunar soil
To examine that hidden structure, the team used synchrotron X-ray microtomography at the Advanced Light Source.
The images revealed grain packs with an overall porosity of roughly 37%, comparable to estimates for lunar regolith deeper than about five meters beneath the surface.
The scans also showed that ice does not simply fill every empty space evenly.
Instead, frozen water appeared both as cement along grain boundaries and as isolated accumulations inside larger pores. Some parts of the samples remained relatively dry, while localized regions contained ice fractions approaching 90%.
Despite this uneven distribution of ice, the overall microstructure appeared largely isotropic, meaning it showed no strong preferred orientation or directional fabric.
Those observations helped the researchers choose the most appropriate physical model for predicting how mixtures of ice and regolith behave mechanically. Among several established effective-medium models, they concluded that the Hashin-Shtrikman approach best represented the complex grain-boundary geometry observed in the laboratory samples.
Using that model, they calculated how seismic velocities should increase as ice content rises.
Both compressional and shear wave speeds increased steadily with increasing ice fraction, while the ratio between the two wave types also changed.
Turning temperature into underground ice maps
Knowing how frozen soil behaves is only part of the problem. The researchers also needed realistic estimates of where ice could survive beneath the lunar surface.
They built thermal models focused on Mons Mouton, a region near the Moon’s south pole selected as the target landing area for NASA’s Volatiles Investigating Polar Exploration Rover (VIPER).
The model simulated heat transfer through the upper 1.5 meters of the lunar surface using a 100-layer representation of the subsurface. Because daily temperature swings become negligible below that depth, deeper layers were treated differently, with additional modeling extending down to 500 meters.
The simulations identified extensive permanently cold regions where ice could remain stable over geological timescales.
Large areas inside several craters remained cold enough to preserve buried ice for billions of years, making them especially attractive targets for future exploration.
Using these temperature predictions, the researchers created four different hypothetical underground ice distributions.
In one scenario, every pore space below 140 kelvin was completely filled with ice, producing crater floors that were entirely frozen.
Another scenario assumed fully frozen ground below 80 kelvin, while regions between 80 and 140 kelvin contained varying amounts of ice that decreased as temperatures rose.
Two additional scenarios distributed ice more diffusely, creating broader halos around crater interiors or restricting scattered ice primarily to the coldest crater floors.
Across all four models, total water content ranged from about 1.3% to 7.6% by weight, consistent with measurements reported by the LCROSS mission.
Simulating earthquakes on the Moon
With realistic underground models in place, the researchers simulated how seismic waves would travel through those icy landscapes.
They used three-dimensional finite-difference wave propagation models covering an area eight kilometers by eight kilometers and extending one kilometer underground.
A simulated moonquake generated vibrations that spread through the different underground ice scenarios while virtual seismometers recorded the signals every 100 meters across the model.
The results showed that ice-rich regions behaved very differently from surrounding dry regolith.
Where frozen material formed continuous underground bodies, seismic waves encountered extremely strong reflective boundaries. Reflection coefficients exceeded 0.9 for both compressional and shear waves, meaning more than 90% of the incoming seismic energy was reflected back rather than passing through.
That produced what the researchers describe as seismic shadow zones.
Inside those frozen regions, seismic amplitudes dropped to only about 10% to 20% of those measured in nearby ice-free terrain. Waves reaching the opposite side of the icy regions largely arrived after bending around their edges or traveling beneath them, and they emerged with substantially reduced amplitudes.
When ice became more diffusely distributed instead of forming continuous frozen layers, another effect became increasingly important.
The seismic energy became progressively scattered.
Rather than maintaining clear wavefronts, the vibrations spread into complicated, depolarized wavefields that produced extended seismic codas and widespread shadow zones.
Models containing the broadest halos of distributed ice generated the strongest scattering, affecting nearly three-quarters of the simulated seismic profile.
Faster waves may reveal how much ice is present
The simulations also showed that buried ice substantially increased seismic velocity.
Any waves traveling through frozen regions exceeded 1,000 meters per second, roughly two to three times faster than waves moving through surrounding dry regolith.
The exact increase depended on how much ice the model contained.
In the most ice-rich scenario, seismic velocities reached roughly 3,500 to 4,000 meters per second, while the sparsest ice model produced velocities around 1,000 meters per second.
According to the researchers, these differences mean that comparing seismic travel times between permanently shadowed regions and nearby ice-free areas could potentially indicate not only whether buried ice exists but also how abundant it may be.
A possible roadmap for future lunar missions
The study proposes a practical approach for future exploration.
A set of seismometers placed both inside and outside permanently shadowed regions, combined with a controlled seismic source positioned either within or outside those areas, could distinguish between different underground ice distributions.
Elevated seismic velocities inside the cold regions would indicate buried ice, while strong shadow zones might point toward sharply bounded frozen deposits. More diffuse scattering patterns could instead signal ice spread more broadly through the surrounding regolith.
The researchers emphasize that scattering alone would not provide definitive evidence because other underground structures unrelated to ice can also scatter seismic waves. However, if changes in velocity and scattering consistently coincide with permanently shadowed regions where temperatures favor long-term ice stability, the combined evidence could become a powerful prospecting tool.
The authors also acknowledge important limitations.
Their laboratory experiments cannot fully reproduce the Moon’s extreme vacuum, thermal cycling, or space-weathering environment. Their seismic simulations also omit realistic topography and many forms of natural subsurface scattering that occur on the Moon.
Even so, they argue that the principal effects identified in the models—higher seismic velocities, shadow zones, and changes in wave scattering associated with buried ice—should remain detectable even in more realistic future simulations.
As new lunar seismometers are deployed by upcoming missions, including instruments planned for the south polar region, the framework developed in this study could help guide efforts to locate and characterize underground water resources before excavation ever begins. Rather than searching for ice by drilling first, future explorers may be able to let the Moon’s own vibrations reveal where its hidden frozen reservoirs lie.
Publication details
Harrison Lisabeth, The seismic signature of Lunar ice, Science Advances (2026). DOI: 10.1126/sciadv.adz7220. www.science.org/doi/10.1126/sciadv.adz7220