For decades, measurements of Earth’s magnetic response to strong solar storms have suggested that the response eventually levels off. A new analysis argues that this apparent saturation may not be a physical limit at all, but a statistical effect caused by the way solar storms are measured.
Why strong storms appear to hit a limit
The interaction between the solar wind and Earth’s magnetosphere drives plasma and electric currents into the upper atmosphere, especially near the polar regions. Scientists track part of this response using a measurement called the Polar Cap Index, or PCI.
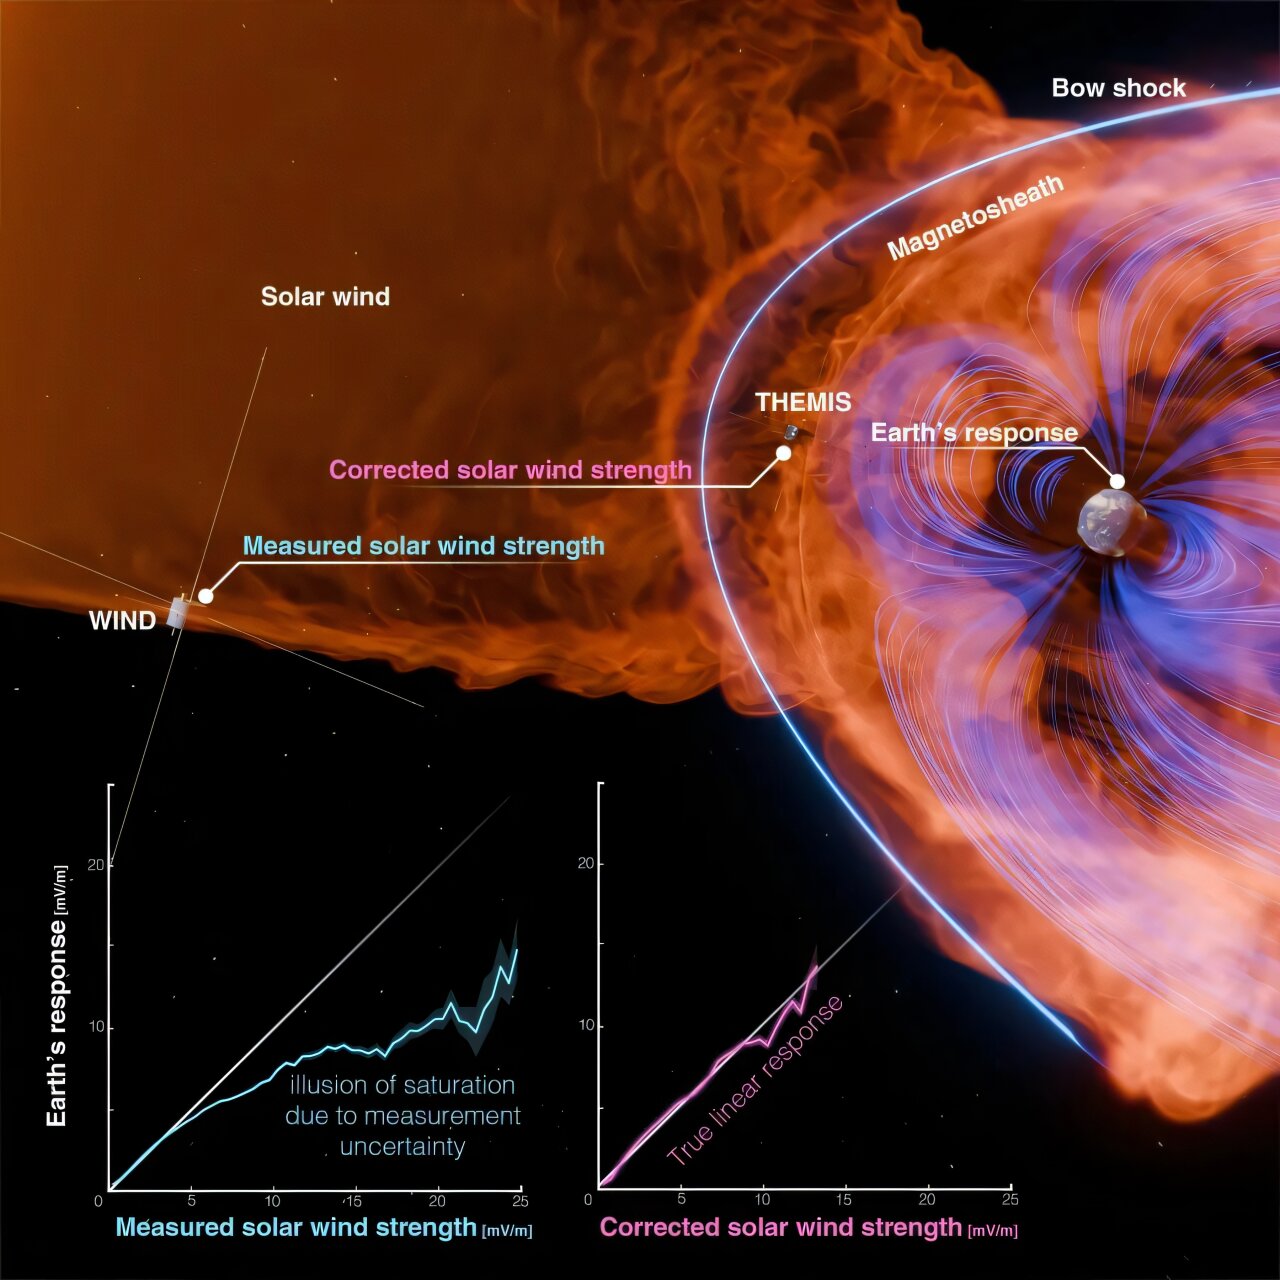
For moderate solar activity, the relationship between the electric field carried by the solar wind and Earth’s electrical response is roughly linear. But during stronger storms, the relationship appears to bend. Earth’s response seems to level off instead of continuing to rise as the solar wind becomes more extreme.
The reason for that apparent saturation has not been clear.
A new paper by Dr. Nithin Sivadas and co-authors at NASA’s Goddard Space Flight Center argues that the apparent limit may come from a problem in the measurements rather than from the magnetosphere itself.
The measurements are made far from Earth
Most measurements of the solar wind used in these analyses come from spacecraft such as WIND, ACE and DSCOVR. These satellites are positioned at the L1 Earth-Sun Lagrange point, about 1.5 million kilometers, or 930,000 miles, closer to the Sun than Earth.
That separation creates uncertainty when scientists try to connect what a spacecraft measures with what eventually reaches Earth’s magnetosphere.
The timing of the solar wind’s arrival can vary, making it difficult to determine precisely when a particular feature measured at L1 reaches Earth. The solar wind can also change as it travels the 1.5 million kilometers between the spacecraft and Earth.
Extreme events create another complication. Shock fronts can produce what is known as heteroskedastic noise, meaning that the random errors in the measurements become larger during extreme events.
Together, these effects mean that an extreme measurement made upstream at L1 does not necessarily represent an equally extreme event when the solar wind reaches Earth.
Regression to the mean can bend the data
This is where regression to the mean becomes important.
When scientists compare extreme solar-wind measurements at L1 with the geomagnetic responses that follow at Earth, the most extreme upstream measurements are paired with responses that are more likely to be closer to average.
That mismatch can produce what the researchers describe as a nonlinear regression bias. Instead of reflecting a genuine physical ceiling, the resulting curve can bend downward and create the appearance that Earth’s response is saturating.
In other words, the apparent flattening may arise partly from uncertainty in the quantity being measured rather than from a limit in Earth’s response.
Correcting the bias changes the relationship
The researchers tested this explanation using a statistical method called regression calibration, designed to offset some of the bias introduced by the uncertain measurements.
After applying the calibration, the previously observed saturation effect disappeared from the relationship. The relationship between solar storm strength and Earth’s magnetic response continued without a clear saturation.
The analysis therefore suggests that the apparent limit may be a statistical artifact rather than evidence that Earth’s magnetosphere naturally caps its response during the strongest storms.
Under this revised relationship, a solar storm occurring at a frequency of roughly once in 1,000 years would be much more likely to produce massive destruction than earlier estimates based on the apparent saturation suggested.
The problem may extend beyond space weather
The researchers also point out that this type of statistical bias is not limited to solar-storm measurements. Similar problems can arise in areas such as seismology and medical trials, where uncertain measurements can make the mean appear to be a meaningful threshold.
Machine-learning systems can also inherit the problem. If a model is trained using uncertain inputs that contain this statistical effect, it can learn the apparent pattern and treat it as though it were a physical feature.
For space weather, the analysis raises a specific concern. Operators of power grids and satellite constellations need to consider the possibility that a severe solar storm could produce a much larger electrical spike than estimates based on the apparent saturation would indicate.
The study was published in Nature.