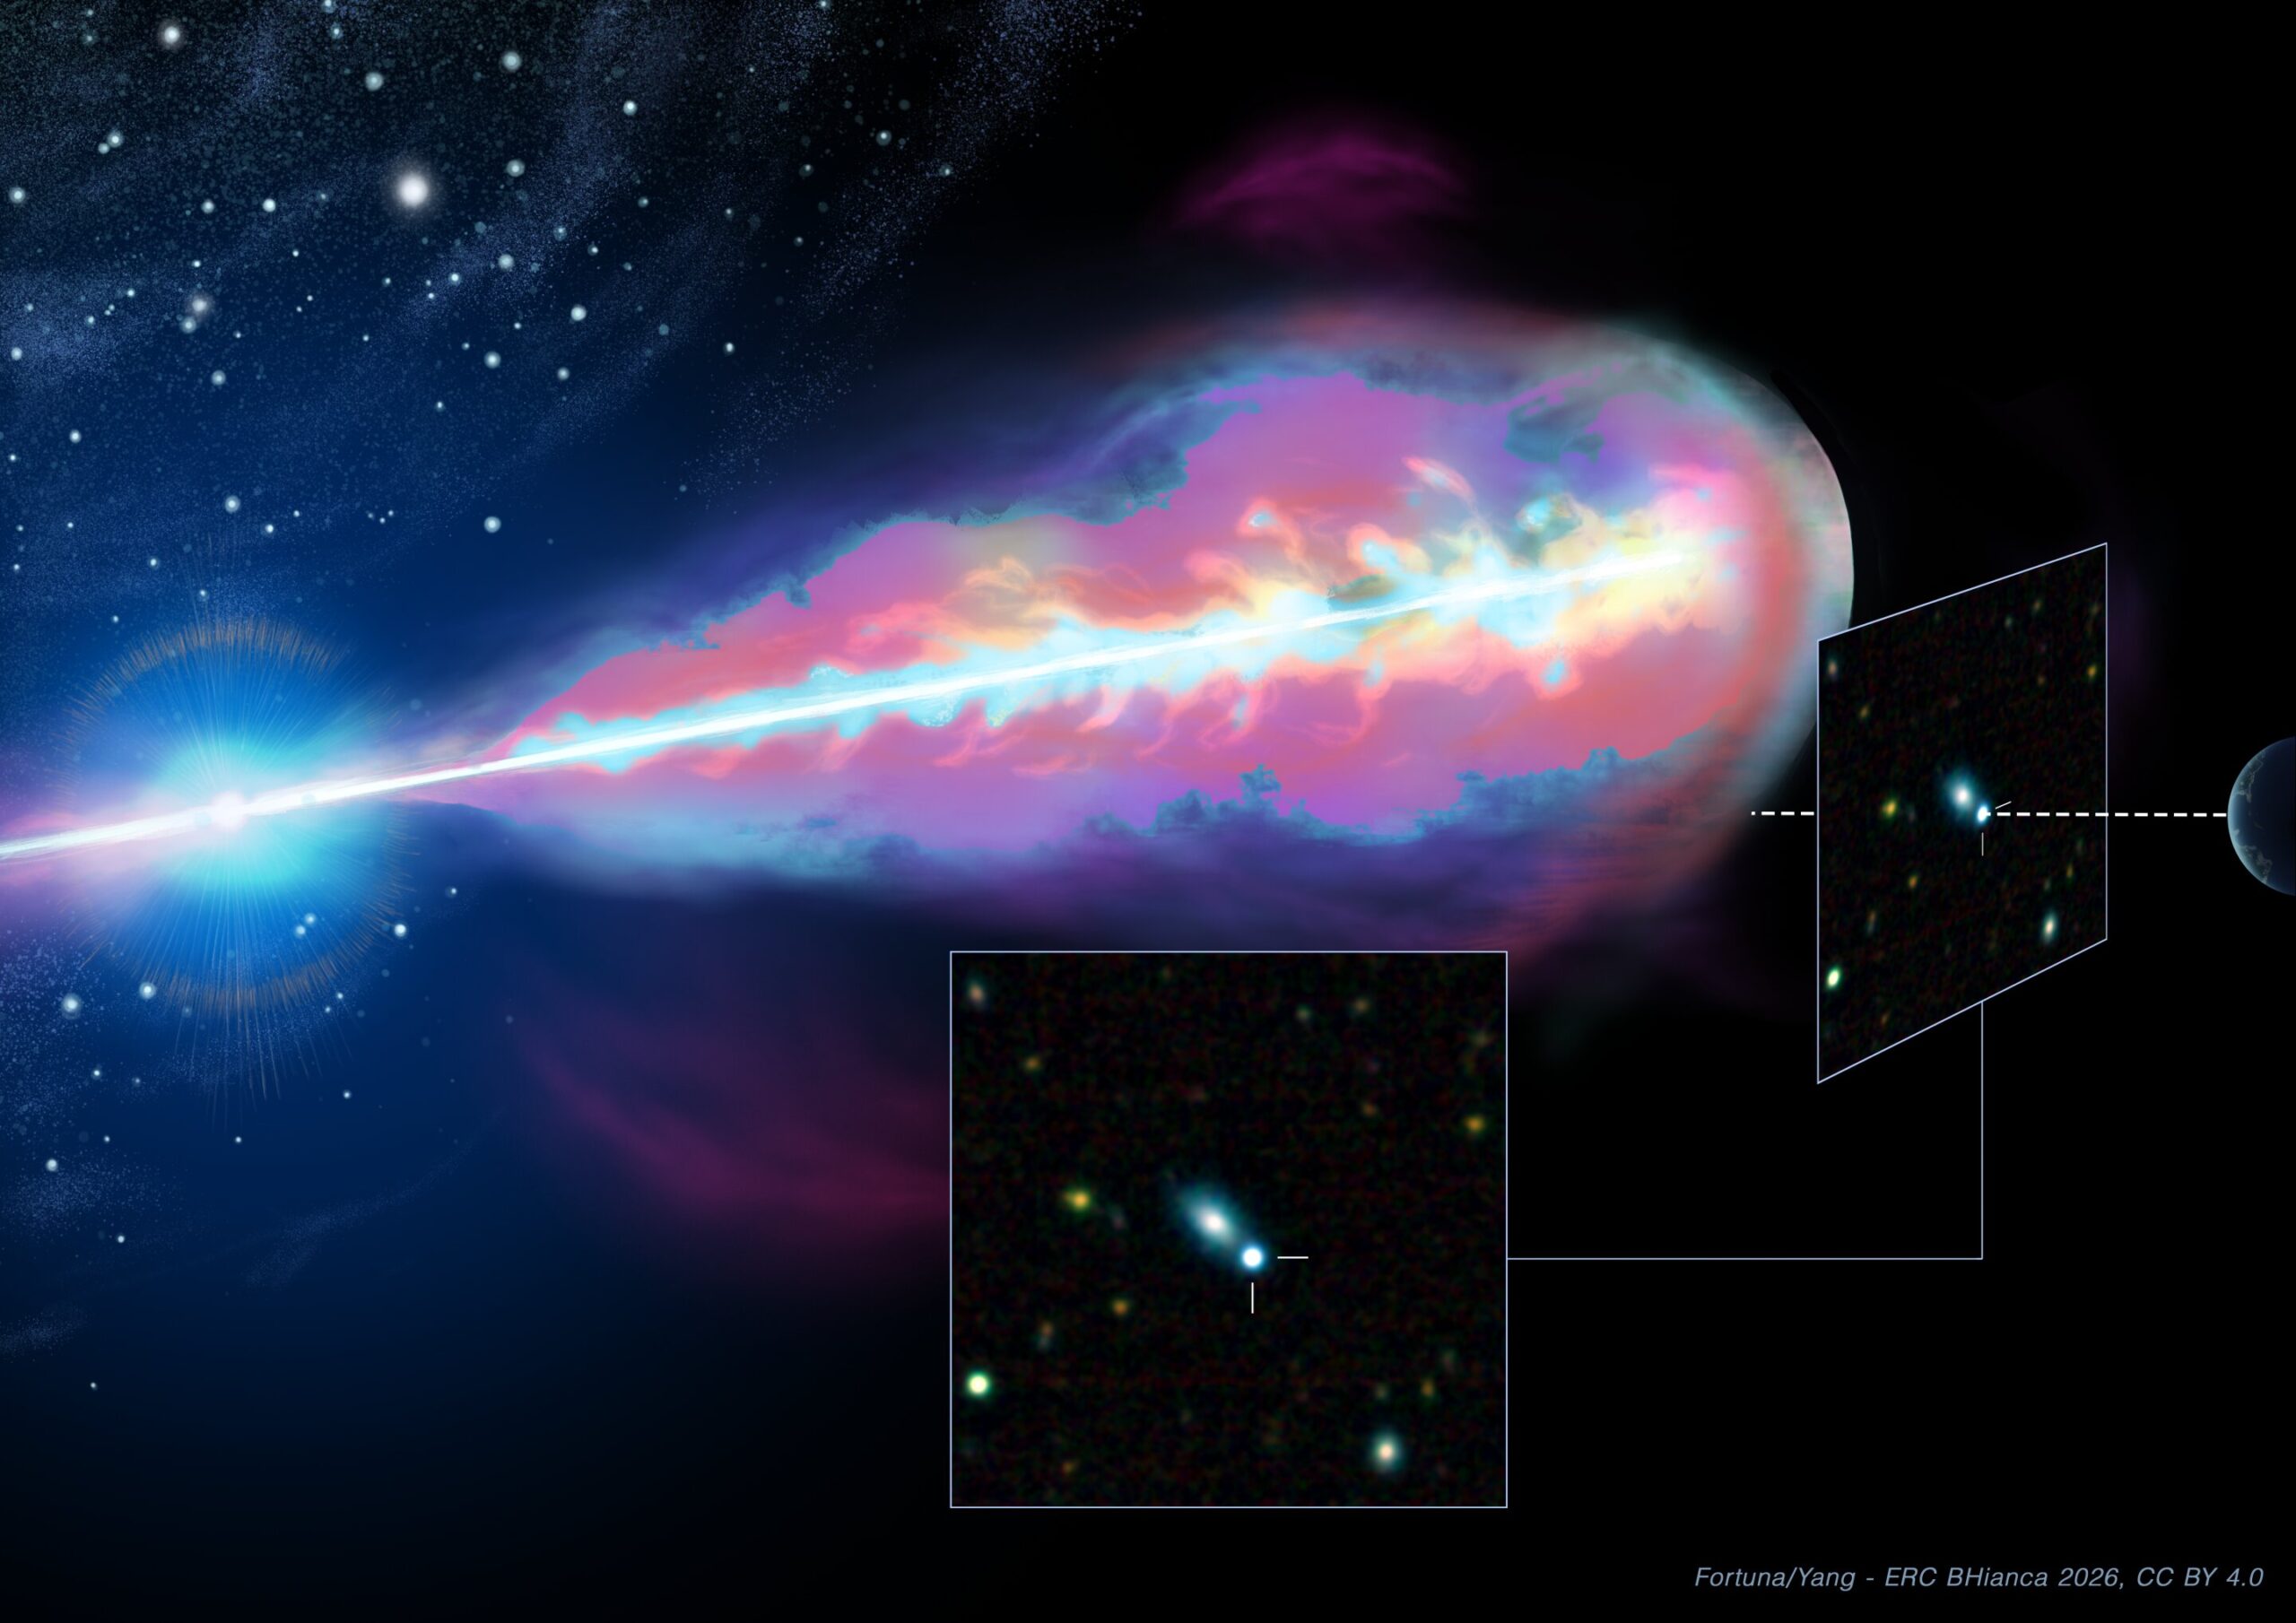
A nearby cosmic explosion produced an unusual combination of relatively weak gamma-ray emission, an exceptionally bright afterglow, and a second X-ray brightening weeks after the initial blast. Its delayed rise and changing emission across different wavelengths point to a powerful relativistic jet viewed from outside its central axis, potentially revealing a more complex structure than astronomers can usually observe.
On March 10, 2026, a burst of gamma rays from a distant galaxy triggered NASA’s Fermi Gamma-ray Space Telescope. The event, designated GRB 260310A, lasted approximately 53 seconds and initially appeared relatively modest compared with many other gamma-ray bursts.
What followed was much less ordinary.
Instead of fading rapidly after the initial explosion, the burst developed an unusually bright afterglow across X-ray, optical, and radio wavelengths. Its visible light brightened gradually for hours before reaching a peak, while its X-ray emission declined, faded more rapidly, and then began brightening again several weeks later.
The combination was difficult to explain using a conventional picture of a gamma-ray burst.
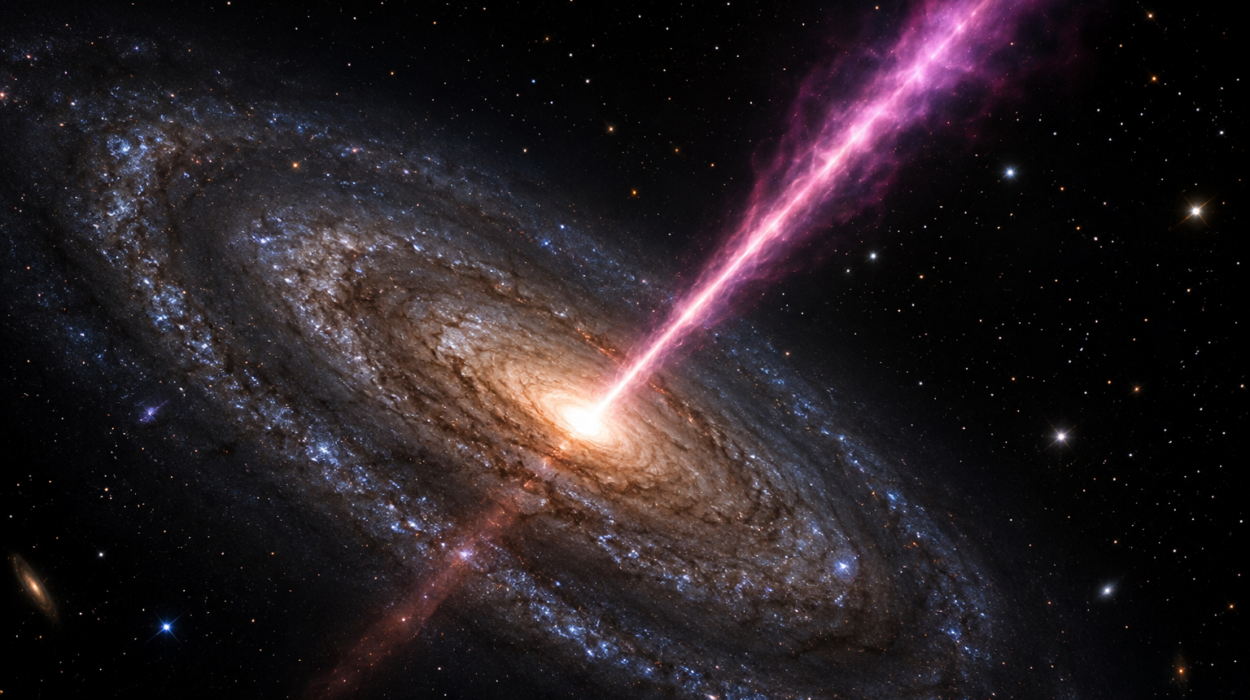
An international research team led by Yu-Han Yang investigated the event using observations from multiple space telescopes and ground-based observatories. Their analysis points toward a possible explanation: the explosion launched a relativistic jet that was not directed straight toward Earth.
In this viewing geometry, the most energetic central part of the jet would initially remain outside the observer’s direct line of sight. As the outflow slows, radiation from progressively more energetic regions can become visible, producing an afterglow that brightens later than expected.
The observations also suggest that the jet may contain two distinct components, with a narrower, more energetic core surrounded by a wider, slower outflow. However, the researchers could not reproduce the entire evolution of the explosion with their standard afterglow models.
A relatively weak gamma-ray burst with an unusually bright afterglow
Gamma-ray bursts are among the most energetic explosions known. They occur when a compact central object drives an extremely fast jet of material into its surroundings.
The initial gamma-ray flash is followed by an afterglow that can remain detectable for days, weeks, or longer. This later radiation is produced as the expanding material interacts with the surrounding environment and generates energetic particles that emit light across the electromagnetic spectrum.
The apparent brightness of a gamma-ray burst depends partly on the direction from which it is observed.
When a jet points approximately toward Earth, relativistic effects concentrate much of its radiation in our direction. Astronomers describe this as an on-axis observation.
When the jet points away from our line of sight, the observed emission is generally weaker. This is known as an off-axis viewing geometry.
GRB 260310A presents an unusual combination of properties that makes this distinction important.
The burst occurred at a redshift of approximately 0.153, making it relatively nearby compared with much of the known gamma-ray burst population. Its isotropic-equivalent gamma-ray energy, a measure of the energy it would have released if its emission were distributed equally in every direction, was approximately 3.5 × 10⁵⁰ erg.
That is relatively modest for a long-duration gamma-ray burst.
Yet its afterglow was exceptionally bright in observations from Earth. Comparisons with hundreds of previously observed bursts placed its X-ray emission among the brightest 1% of the sample. Its optical emission was brighter than 99% of the comparison sample, while its radio emission exceeded the observed fluxes of more than 95%.
Distance, however, changes the interpretation of these comparisons.
Because GRB 260310A is relatively close, its observed brightness is substantially enhanced. After correcting for distance and other observational effects, its X-ray, optical, and radio luminosities fall within the broad distribution of ordinary cosmological gamma-ray bursts.
Its X-ray luminosity at the comparison epoch was actually within the lower 15% of the population.
The unusual feature is therefore not simply that the explosion was intrinsically more powerful than other bursts. It is the mismatch between its relatively modest initial gamma-ray energy and the brightness and evolution of its subsequent emission.
The optical afterglow took hours to reach its brightest point
One of the strongest clues about the geometry of the explosion comes from its early optical behavior.
The researchers assembled optical and near-infrared observations from several facilities, including the BOOTES network, the Observatorio de Sierra Nevada, the Large Binocular Telescope, and observatories in Ondřejov.
These observations tracked how the burst’s brightness changed in different filters over time.
The earliest optical measurements showed that the afterglow was still relatively faint approximately 17 minutes after the gamma-ray trigger, with a brightness of about 18.8 AB magnitude.
Over the following hours, it gradually brightened. By approximately 0.3 days after the explosion, its brightness had reached about 16.7 AB magnitude.
The optical emission initially rose with a temporal slope of approximately −1, using the convention adopted by the researchers for the afterglow light curves.
It then transitioned into a relatively shallow decline, with a temporal slope of approximately 0.67.
The broad optical peak occurred around 0.1 days after the burst, although the population comparison in the study describes the peak brightness at approximately 0.2 days.
This delayed rise is important because conventional highly relativistic jets viewed directly along their axes are expected to reach their afterglow peak much earlier, often within minutes.
An observer positioned away from the jet axis can see a different evolution.
Relativistic motion concentrates radiation into a narrow range of directions. When the jet is initially pointed away from the observer, much of its brightest emission is directed elsewhere.
As the jet slows, its radiation becomes visible over a wider range of angles. The observer can then receive increasingly strong emission from regions that were previously outside the effective viewing direction.
This can produce a delayed and more gradual afterglow rise.
The researchers therefore interpret the slow optical brightening as evidence supporting an off-axis jet.
However, a delayed afterglow peak does not establish this geometry by itself. A relatively low initial Lorentz factor, meaning a less extreme relativistic speed, could also produce a delayed peak.
The team considered both possibilities.
The gamma-ray spectrum adds another clue
The initial gamma-ray properties provide an independent reason to consider an off-axis explanation.
Fermi’s Gamma-ray Burst Monitor recorded a single pulse with a fast rise followed by an exponential decline. The measured duration, known as T₉₀, was approximately 53 seconds, with substantial uncertainty.
The team fitted the time-integrated gamma-ray spectrum using a cutoff power-law model.
They obtained a photon index of approximately −0.2 and a peak energy of about 157 keV.
The measured gamma-ray fluence was approximately 5.2 × 10⁻⁶ erg per square centimeter in the 10–1000 keV energy range. This corresponds to an isotropic-equivalent energy of approximately 3.5 × 10⁵⁰ erg in the burst’s rest frame.
The combination of relatively low energy and a comparatively hard spectrum places GRB 260310A away from the usual distribution of long-duration gamma-ray bursts in the Amati relation.
This empirical relationship connects the peak energy of a burst’s gamma-ray spectrum with its total isotropic-equivalent gamma-ray energy.
GRB 260310A has a relatively hard spectral peak despite its modest energy output. Its position in the diagram initially made its classification less straightforward.
The associated supernova, however, establishes that the event belongs to the long-duration, massive-star explosion category rather than being identified as a conventional short burst.
The researchers argue that viewing geometry can explain the unusual gamma-ray properties.
If the jet is observed slightly away from its central axis, relativistic Doppler boosting is reduced. This can substantially lower the observed gamma-ray energy while shifting the characteristic photon energy downward by a smaller amount.
Their analysis suggests that an angular offset of approximately two to three times the jet core’s half-opening angle could reconcile the observed prompt emission with the Amati relation.
This is a model-dependent interpretation rather than a direct measurement of the viewing angle.
The researchers also considered whether a relatively low Lorentz factor could explain the delayed optical peak. Their compactness argument allows a Lorentz factor of approximately 10 or greater, meaning that a moderately relativistic, baryon-loaded outflow cannot be excluded using that constraint alone.
Nevertheless, the relatively hard gamma-ray spectrum tends to disfavor this explanation because such outflows are generally expected to produce softer emission.
The authors therefore favor an off-axis interpretation.
X-rays revealed a second brightening weeks after the explosion
The optical observations were only part of the story.
The research team also followed the explosion in X-rays using the Follow-up X-ray Telescope aboard the Einstein Probe, NASA’s Chandra X-ray Observatory, XMM-Newton, and NuSTAR.
The first Einstein Probe follow-up observation began approximately 2.5 days after the gamma-ray trigger.
The team subsequently obtained 19 observations with the telescope between March 14 and April 25, 2026.
Additional observations from the other X-ray facilities helped track the changing emission and investigate whether a nearby source might be affecting the measurements.
The resulting light curve revealed several distinct stages.
Initially, the X-ray afterglow declined relatively slowly, with a temporal slope of approximately 0.34.
At around 9.1 days, the emission underwent a transition into a much steeper decline, with a slope of approximately 2.5.
The behavior changed again between approximately 18 and 30 days after the explosion.
During this period, the X-ray afterglow developed a prominent rebrightening, reaching a renewed level of emission before fading again.
The researchers fitted the light curve using a four-segment smoothly broken power-law model.
The rebrightening was particularly interesting because it was not simply a continuation of the original afterglow decline.
Chandra observations at approximately 41 days helped establish that the increased X-ray emission was genuinely associated with the gamma-ray burst.
Chandra’s superior angular resolution allowed the researchers to distinguish the afterglow from two weaker nearby X-ray sources that could not be resolved as clearly by the Einstein Probe telescope.
This confirmed that the late brightening was an intrinsic feature of GRB 260310A rather than contamination from another source.
The team continued monitoring the event through approximately 68 days after the explosion.
Despite the substantial changes in brightness, the X-ray spectrum remained remarkably stable.
The researchers divided the observations into two periods, one covering approximately 2.6–11 days and the other covering approximately 15–47 days.
They found photon indices of 1.80 ± 0.04 and 1.82 ± 0.05, respectively.
These measurements are consistent within their uncertainties and provide no evidence for significant spectral evolution.
The intrinsic hydrogen column density inferred from the X-ray observations was also consistent across the two periods, at approximately 1.6 × 10²¹ per square centimeter.
This stable spectral behavior became important when the researchers investigated the physical origin of the late-time rebrightening.
The optical brightening came from a supernova
Although the optical and X-ray light curves displayed changes on comparable timescales, their spectra revealed that the two wavelength ranges were not necessarily tracing the same emission component.
To investigate the optical emission, the researchers obtained spectra at two different epochs.
The first observation took place approximately 2.9 days after the explosion using the 2.2-meter telescope at Calar Alto Observatory in Spain.
At that stage, the spectrum was dominated by a relatively featureless continuum consistent with emission from the gamma-ray burst afterglow.
A second observation approximately 26 days after the explosion revealed a different picture.
Broad undulations had emerged across the optical spectrum. These features are characteristic of broad-lined Type Ic supernovae, whose rapidly expanding ejecta produce heavily blended and broadened atomic absorption and emission features.
Two broad spectral peaks appeared around rest-frame wavelengths of 4,600 and 5,800 angstroms.
The researchers associated the emission around 4,600 angstroms primarily with blended iron absorption and emission features involving Fe II multiplets. Nearby broad absorption features were attributed to strongly blueshifted Fe II and Si II transitions.
Together, these observations provided spectroscopic evidence for the emergence of a supernova component.
This distinction matters because the X-ray rebrightening did not have an equivalent nonthermal signature in the optical spectrum.
If the same X-ray-emitting power-law component continued into the optical band without a spectral break, it would predict more optical emission than the researchers actually observed.
Instead, the optical emission increasingly included light from the supernova.
The authors therefore infer that the broadband radiation contains multiple components whose relative contributions change over time.
At earlier stages, the optical emission likely combines radiation from the forward and reverse shocks. At later stages, the supernova becomes increasingly important in the optical and near-infrared bands, while the forward shock continues to dominate the nonthermal X-ray emission.
Radio observations point to two shock components
The radio observations provided another important piece of evidence.
The team used the Karl G. Jansky Very Large Array to observe GRB 260310A across multiple frequencies.
Radio measurements began earlier, but dense coverage of the radio spectrum became available approximately 17 days after the explosion.
At this stage, the optical and X-ray afterglows had already undergone substantial changes.
The radio spectrum displayed different behaviors at different frequencies.
At frequencies below approximately 4 GHz, the radio flux increased steeply toward higher frequencies, a characteristic feature of optically thick synchrotron emission.
At higher frequencies, the spectrum was consistent with optically thin emission.
Synchrotron radiation is produced when energetic charged particles, particularly electrons, move through magnetic fields and emit electromagnetic radiation.
The researchers modeled the radio spectral energy distributions using a smoothly broken power law with two characteristic frequencies.
One is the synchrotron self-absorption frequency, νₐ, below which the emitting material becomes increasingly opaque to its own radiation.
The other is the characteristic synchrotron frequency, νₘ, associated with the lowest-energy electrons participating in the accelerated particle distribution.
Their analysis indicated that the electron energy distribution followed a power-law index of approximately 2–2.3, depending on the assumed smoothness of the spectral transitions.
The radio measurements also revealed how the characteristic frequencies evolved.
The peak flux declined approximately as t⁻⁰·⁷, while the characteristic frequencies generally decreased with time.
At approximately 17 days, the inferred characteristic frequencies were around 17 GHz for νₘ and 5 GHz for νₐ.
By approximately 50 days, the corresponding estimates were around 6 GHz and 2 GHz.
The researchers noted that the values at 50 days deviated from the general evolution inferred from the other epochs.
This spectral behavior is important because the radio-derived electron index did not match the values required if the early optical and X-ray emission came entirely from a single forward-shock component.
The team therefore considered a two-component emission model.
In this picture, a forward shock travels outward into the surrounding environment, while a reverse shock propagates backward through the expanding ejecta.
The forward shock is expected to contribute strongly at higher frequencies, including X-rays, while the reverse shock can produce substantial lower-frequency emission, particularly in the radio.
The researchers propose that a bright reverse shock contributed significantly to the early radio and optical emission.
The radio spectral energy distributions are consistent with the presence of both shock components, although the observations do not establish a complete physical description of their evolution.
Low radio polarization suggests the forward shock eventually dominated
Polarization measurements provided an additional way to investigate the relative contributions of the two shock components.
Synchrotron radiation can be polarized because the emitting electrons move through magnetic fields with particular orientations.
The degree of linear polarization can therefore provide information about the geometry of the emitting region and the structure of its magnetic fields.
The team obtained radio polarization measurements with the Very Large Array approximately 55 days after the burst.
At 15 GHz, they measured a linear polarization fraction of approximately 1.7% ± 0.4%.
They also derived upper limits of less than 1.7% at 6 GHz and less than 2.5% at 10 GHz.
The researchers compared the 15 GHz result with an earlier reported polarization fraction of approximately 3.2% for an optically thin, reverse-shock-dominated radio spectrum.
The lower polarization measured at 55 days is consistent with a transition toward emission dominated by the forward shock.
In their interpretation, the forward shock had become the dominant nonthermal emission component across the radio-to-X-ray range by this stage.
The radio-to-X-ray spectral index was approximately 0.65, corresponding to an electron energy distribution index of approximately 2.3.
The researchers also inferred that the synchrotron cooling frequency, the frequency above which radiating electrons lose a substantial amount of their energy through radiation, was located within the X-ray band.
However, polarization does not provide a definitive measurement of jet geometry or shock dominance by itself.
The polarization signal depends on several factors, including magnetic-field structure, viewing angle, the relative contributions of different emission components, and the frequency being observed.
The researchers also lacked sufficiently reliable polarization measurements across multiple epochs to establish a detailed time-dependent evolution.
Their optical polarimetry measurements at approximately 2 and 3 days produced polarization fractions of 2% ± 2% and 4% ± 2%, respectively. Both were consistent with no significant polarization detection.
Consequently, the radio polarization result supports the proposed transition between reverse-shock and forward-shock dominance but does not uniquely establish the physical configuration.
A possible two-component jet explains the changing afterglow
The combination of the delayed optical peak, the relatively weak prompt gamma-ray emission, and the late X-ray rebrightening led the researchers to investigate whether GRB 260310A contained more than one distinct angular component.
A two-component jet consists of a narrow, highly energetic central region surrounded by a wider, less energetic outflow.
The two regions can produce different stages of the observed afterglow, particularly when the explosion is viewed away from its central axis.
Under this interpretation, the early optical and X-ray behavior could be associated primarily with the wider component.
Its emission would initially be visible to the observer, producing the first afterglow peak around 0.1 days.
The change in the light curve around 9 days could then correspond to the outer edge of this wider component entering the observer’s effective field of view.
The later X-ray rebrightening could have a different origin.
As the narrower and more energetic central jet slows, its relativistic beaming becomes less restrictive. Its radiation could gradually become visible to an observer located outside the jet’s central direction.
This would produce a second increase in the observed X-ray emission.
In this scenario, the two peaks would reflect different angular regions of the same explosion becoming visible at different stages of its evolution.
The researchers emphasize that this is a possible interpretation rather than an established reconstruction of the jet.
They also considered another explanation for the late X-ray emission: inverse-Compton scattering of optical photons from the emerging supernova.
In this process, energetic electrons transfer energy to lower-energy photons, increasing their frequency.
Because the supernova and X-ray rebrightening develop on broadly comparable timescales, the possibility initially appears worth considering.
However, the researchers found that for typical physical parameters, the expected inverse-Compton emission would peak at or above the X-ray band rather than naturally producing the observed relatively featureless X-ray spectrum.
The observed X-ray luminosity, approximately 10⁴³ erg per second, also disfavors this explanation.
Together with the stable X-ray spectral index and radio measurements, the authors favor synchrotron radiation from the forward shock as the dominant source of the X-ray emission.
Another possible explanation is late energy injection, in which additional energy enters the expanding blast wave and refreshes the shock.
Such a process can produce renewed afterglow emission without requiring a second angular component.
The researchers note that late-time rebrightenings have been observed in other gamma-ray bursts and fast X-ray transients.
However, the available observations do not establish whether energy injection or the emergence of a narrower jet component is responsible for GRB 260310A’s late X-ray behavior.
The late X-ray rise may be less unusual than observations suggest
The researchers also examined how frequently gamma-ray bursts are monitored long enough to reveal similar late-time behavior.
They found that only approximately 1% of more than 1,300 long-duration gamma-ray bursts in the Swift X-ray afterglow archive had X-ray coverage extending beyond 15 days.
The optical comparison catalog showed a similar limitation in long-term monitoring.
This creates an observational problem.
Many gamma-ray burst afterglows become too faint for detailed follow-up observations after their initial decline. Without sufficiently long and sensitive monitoring, a second brightening could easily go unnoticed.
Optical observations introduce another complication because the emerging supernova can dominate the light, potentially concealing changes in the underlying nonthermal afterglow.
The researchers therefore caution that the apparent rarity of late-time rebrightenings may partly reflect limited observational coverage rather than their true frequency.
GRB 260310A was observed deeply enough to reveal a second X-ray brightening between approximately 20 and 30 days after the initial explosion.
Its evolution was also different from many previously reported examples, developing on a somewhat longer timescale and appearing relatively faint in the comparison sample.
The authors suggest that off-axis viewing could provide an alternative explanation for at least some of these late-time structures.
Modeling the explosion did not reproduce its full evolution
To investigate the physical properties of the outflow, the researchers fitted the broadband observations using the VegasAfterglow modeling framework.
Their analysis considered several possible jet configurations, including uniform jets, Gaussian jets, power-law structured jets, and two-component jets.
They also tested different surrounding environments, including uniform-density and wind-like density profiles.
The models incorporated both forward-shock and reverse-shock emission.
A relatively simple forward-shock model involving an off-axis Gaussian jet in a uniform-density environment provided a reasonable description of much of the observed broadband emission.
Using an electron energy distribution index of approximately 2, the model reproduced most of the available observations up to around 20 days.
At approximately 17 days, the fitted model gave a self-absorption frequency of around 6 GHz, a characteristic synchrotron frequency of around 12 GHz, and a cooling frequency of approximately 3 × 10¹⁴ Hz.
However, this solution had important shortcomings.
It systematically underpredicted the hard X-ray and millimeter observations and did not account for the supernova contribution to the optical emission.
More importantly, it could not explain the late X-ray rebrightening.
Adding a reverse-shock component did not produce a satisfactory overall fit either.
The researchers found that none of the tested combinations of reverse-shock and forward-shock models, using either uniform or wind-like surrounding environments, could reproduce the full broadband dataset and its temporal evolution.
This suggests that the explosion’s behavior is more complicated than the simplest standard afterglow prescriptions can describe.
The researchers considered whether additional physical processes, including energy injection and refreshed shocks, might help explain the discrepancies.
They also tested a separate two-component jet model specifically designed to reproduce the late X-ray brightening and radio observations after approximately 50 days.
In that scenario, the narrower central component had a half-opening angle of approximately 0.8 degrees, an initial Lorentz factor of around 150, and an isotropic-equivalent kinetic energy of approximately 2 × 10⁵⁴ erg.
The observer’s viewing angle was approximately 10 degrees.
Surrounding this narrow core was a wider and slower component with a half-opening angle of approximately 16 degrees, an initial Lorentz factor of around 15, and an isotropic-equivalent kinetic energy of approximately 5 × 10⁵² erg.
The model could reproduce the late-time X-ray brightening.
However, it was not a complete fit to the entire explosion. The early optical and radio emission were attributed to a reverse shock and treated as upper limits in the modeling of the forward-shock component.
These parameters therefore describe one possible configuration capable of explaining selected observations, not a definitive measurement of the actual jet structure or energy distribution.
The implications of the proposed geometry are particularly sensitive to the viewing angle.
The researchers note that a relatively modest offset from the jet core could reconcile the observed gamma-ray properties with the standard long-duration burst population.
A substantially larger offset, however, would imply much greater intrinsic gamma-ray energetics for an observer looking directly along the jet axis.
The late X-ray rebrightening therefore provides an important constraint on whether a two-component jet can explain the observations consistently.
For GRB 260310A, the slow initial optical rise, unusual prompt gamma-ray properties, radio spectrum, polarization measurement, and late X-ray brightening collectively support an off-axis interpretation with multiple emission components.
But the standard reverse-shock and forward-shock models tested by the researchers could not reproduce the entire evolution, leaving the detailed physical structure of the explosion unresolved.
The study was published in The Astrophysical Journal Letters.