The Southern Ocean begins the simulations as a modest carbon sink, but as atmospheric CO₂ rises and then declines, the region follows a very different path from most of the ocean. By the end of the modeled period, it is releasing roughly 8 to 9 grams of carbon per square meter each year, even though atmospheric CO₂ has fallen sharply. The simulations point to persistent warming at the ocean surface, a decline in surface alkalinity, and unusually efficient air-sea gas exchange as the combination behind the reversal.
The Southern Ocean, defined in this study as the region between 63°S and 47°S, initially absorbs CO₂ from the atmosphere. During 2001 to 2005, its modeled uptake was about −2.8 grams of carbon per square meter per year, equivalent to about −0.1 petagrams of carbon per year. As anthropogenic emissions increase, the ocean’s uptake strengthens. But once emissions begin falling, that uptake declines rapidly.
The reversal becomes especially pronounced during the later part of the simulations. During the final 100-year restoring period, the Southern Ocean releases about 8.6 grams of carbon per square meter per year, or 0.33 petagrams of carbon per year, in the zero-emissions scenario. In the negative-emissions scenario, the corresponding release is about 8.5 grams per square meter per year, or 0.35 petagrams per year.
That behavior is unusual compared with much of the rest of the ocean. The tropics also become a source during the same period, releasing about 4.8 grams of carbon per square meter per year in the zero-emissions case and 6 grams per square meter per year in the negative-emissions case. Because the tropics cover a much larger area, they produce a slightly larger total source. But the change in the Southern Ocean is substantially larger relative to its starting state, making the region a disproportionate contributor to the modeled increase in global ocean outgassing.
The contrast is important because the global ocean does not undergo the same reversal. In the simulations, the global mean remains a weak net CO₂ sink during the restoring period. In the zero-emissions experiment, it absorbs about 0.54 petagrams of carbon per year, while in the negative-emissions experiment it absorbs about 0.23 petagrams per year. The Southern Ocean therefore follows a distinctly different trajectory from the global average.
The simulations follow CO₂ up and back down
The researchers used the Community Earth System Model version 2, or CESM2, coupled with the Marine Biogeochemistry Library. The model represents the atmosphere, ocean, land, sea ice and ocean and land carbon cycles, including carbonate chemistry, nutrient cycles and several types of plankton and zooplankton.
They ran two idealized emission experiments. In both, anthropogenic CO₂ emissions rise linearly from 2001 to 2050 and then decline. One experiment reaches zero emissions in 2123 and keeps them there through 2400. The other introduces negative emissions beginning in 2123, using direct air capture, until atmospheric CO₂ returns to its initial level of about 383 parts per million around 2197. Emissions then remain at zero through 2400.
The simulations are emission-driven, meaning atmospheric CO₂ is not simply prescribed independently. It changes in response to the specified anthropogenic emissions as well as exchanges with the ocean and land biosphere. The researchers ran 10 ensemble members for each experiment, each with slightly different initial conditions, and used a 1° by 1° horizontal grid.
The model’s globally integrated ocean CO₂ uptake from 2001 to 2020 was about 2 petagrams of carbon per year, similar to observation-based estimates cited by the researchers. The authors caution, however, that their idealized simulations are not directly comparable with the recent historical period.
Ocean CO₂ stays high while the atmosphere falls
The direction of CO₂ exchange between ocean and atmosphere depends primarily on the difference between their CO₂ partial pressures, which the researchers call ΔpCO₂. When atmospheric CO₂ partial pressure is higher than the ocean’s, CO₂ moves into the ocean. When the ocean’s partial pressure becomes higher, the direction reverses.
During the rising-CO₂ phase, atmospheric CO₂ remains higher than oceanic CO₂ in the Southern Ocean, allowing continued uptake. But after atmospheric CO₂ reaches its peak, the relationship changes. Oceanic CO₂ partial pressure rises above atmospheric CO₂ and remains higher, producing a positive ΔpCO₂ and turning the Southern Ocean into a modeled CO₂ source.
To determine why oceanic CO₂ partial pressure changes in this way, the researchers separated its response into contributions from sea surface temperature, dissolved inorganic carbon, alkalinity and freshwater. The freshwater contribution was negligible in the Southern Ocean in both experiments. Changes in dissolved inorganic carbon followed the atmospheric CO₂ trajectory and became relatively unimportant as atmospheric CO₂ declined. In the negative-emissions experiment, the dissolved-inorganic-carbon contribution eventually acted to reduce the change in oceanic CO₂ partial pressure.
Two other factors behaved differently. Sea surface temperature and surface alkalinity consistently pushed oceanic CO₂ partial pressure upward. During the final restoring period, their positive contributions were pronounced, while dissolved inorganic carbon had only a minor or negative contribution.
Southern Ocean warming persists after atmospheric CO₂ starts falling
The strongest regional contribution comes from sea surface temperature. When the researchers removed the global mean response from each factor, the Southern Ocean’s temperature contribution remained markedly larger than the global mean. By the end of the simulations, the Southern Ocean’s sea surface temperature change was about 0.25°C above the global mean in the negative-emissions experiment and about 1°C above the global mean in the zero-emissions experiment.
The modeled warming is linked to heat that had previously accumulated inside the ocean during the warming phase. As atmospheric CO₂ declines, that stored heat is gradually released toward the surface over decades to centuries. The authors identify changes in low-level clouds and the loss of sea ice as processes that impede efficient heat loss to the atmosphere and amplify surface warming in the simulations.
The warmer surface water then reduces CO₂ solubility and changes the carbonate chemistry of the ocean, raising oceanic CO₂ partial pressure and favoring CO₂ release. The researchers therefore identify regionally intensified sea surface warming as the dominant factor distinguishing the Southern Ocean’s response from the global mean.
Alkalinity provides a second contribution. Surface alkalinity declines across large areas of the global ocean, including the Southern Ocean. The decline weakens the ocean’s carbonate buffering capacity, making it less effective at taking up CO₂. But because the alkalinity change is widespread rather than uniquely concentrated in the Southern Ocean, its regional anomaly is much smaller than the temperature contribution.
In the simulations, continued biological export and limited physical resupply from deeper water drive much of the alkalinity decline. The researchers find that primary production, particularly by small phytoplankton, continues to increase south of 30°S under the modeled conditions, accompanied by greater calcium carbonate production. This promotes the transfer of alkalinity into poorly ventilated deep water. At the same time, increasing upper-ocean stratification reduces the upward transport of alkalinity-rich deep water.
The resulting reduction in surface dissolved inorganic carbon is interpreted as further evidence that warming-driven CO₂ loss, rather than increased upwelling of carbon-rich deep water, is the main reason for the Southern Ocean’s regional outgassing response.
Strong winds make the carbon release more efficient
Warming and alkalinity changes explain why the ocean’s CO₂ partial pressure rises, but they do not by themselves explain why the Southern Ocean releases so much CO₂.
The tropics, for example, become even warmer in the simulations. During the restoring period, tropical sea surface temperature remains about 1.2°C higher than the initial state in the negative-emissions experiment and 2.7°C higher in the zero-emissions experiment. The tropics also develop the largest positive ΔpCO₂. Yet their CO₂ outgassing is weaker than that of the Southern Ocean.
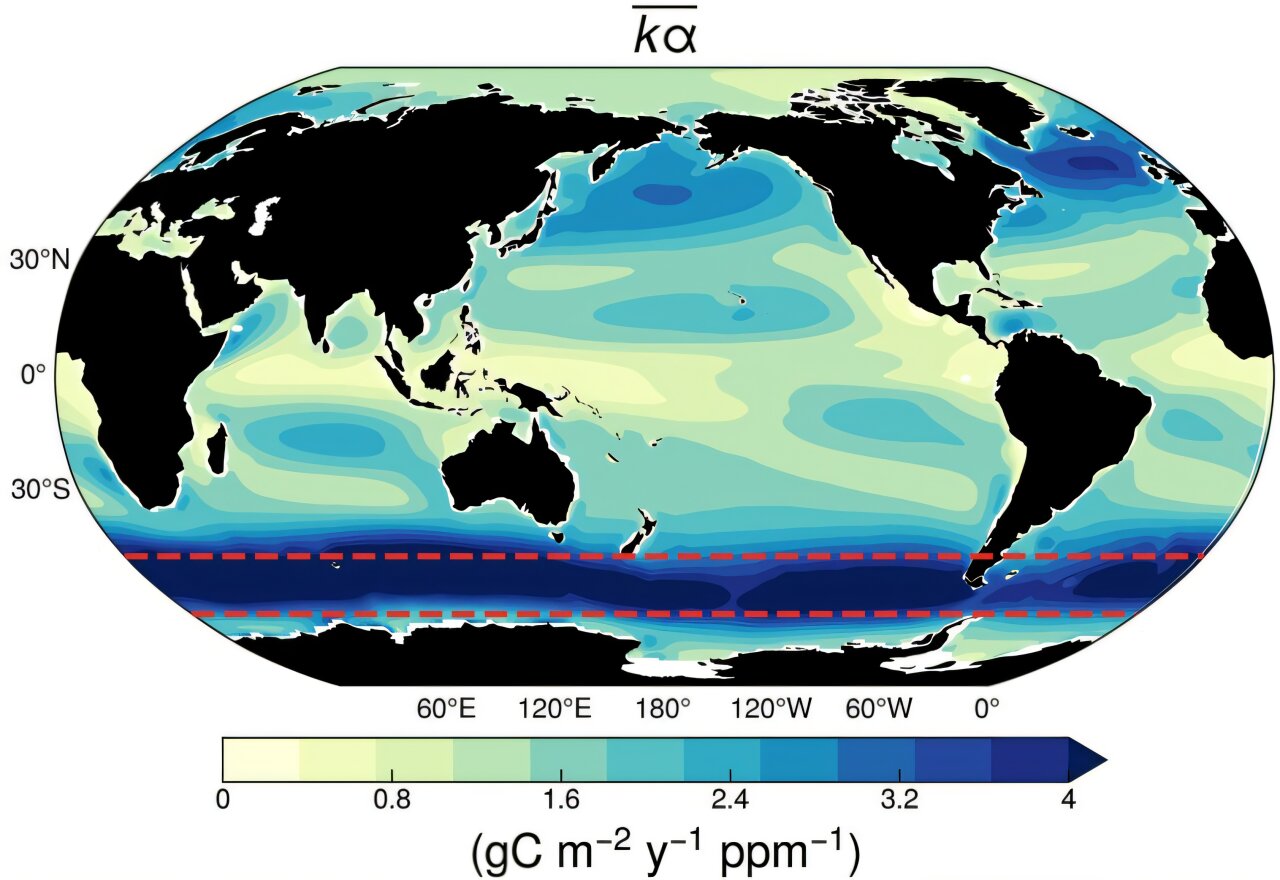
The missing factor is the efficiency with which CO₂ crosses the ocean surface. The researchers describe this using a gas-transfer coefficient, kα, which combines gas-transfer velocity with CO₂ solubility. Wind speed strongly influences this coefficient, although changes in wind speed caused by climate change itself are negligible in these simulations.
The Southern Ocean starts with a gas-transfer coefficient nearly twice the global mean. During 2001 to 2005, its modeled value is about 4 grams of carbon per square meter per year per part per million, compared with roughly 2 grams globally. The region’s strong westerly winds and high CO₂ solubility account for this unusually high value.
That high transfer efficiency becomes particularly important once the ocean’s CO₂ partial pressure moves slightly above the atmosphere’s. A modest positive ΔpCO₂ produces a comparatively large flux because the Southern Ocean exchanges gas with the atmosphere so efficiently. The tropics have a larger positive ΔpCO₂ but lower gas-transfer efficiency because of weaker winds and lower CO₂ solubility.
The researchers tested this mechanism by recalculating Southern Ocean CO₂ flux while replacing its regional gas-transfer coefficient with the global mean. That substitution substantially shrank the modeled hysteresis in the Southern Ocean’s CO₂ flux. By the end of the negative-emissions experiment, the resulting Southern Ocean flux came close to the global mean.
The ocean does not simply retrace its path
The researchers describe the behavior as hysteresis, meaning the ocean does not follow the same path back as atmospheric CO₂ declines that it followed while CO₂ was rising.
Surface alkalinity shows a clear hysteresis loop. Its recovery trajectory fails to retrace the path taken during the CO₂ increase, and the simulations show that the change persists through at least 2400. By the end, surface alkalinity is about 11 millimoles per cubic meter below its initial state in the negative-emissions experiment and 25 millimoles per cubic meter below it in the zero-emissions experiment.
Sea surface temperature also displays an open-loop hysteresis. During the period when atmospheric CO₂ rises, global and Southern Ocean surface temperatures increase by about 1.7°C. During the decline, the Southern Ocean remains roughly 1°C warmer than the global mean in the modeled response described by the authors.
The Southern Ocean’s CO₂ flux follows the same basic pattern. During the CO₂ ramp-up, its uptake strengthens roughly in line with the global ocean. During the ramp-down, however, its trajectory diverges. When atmospheric CO₂ returns to its initial concentration, the Southern Ocean releases nearly 2.5 times more CO₂ than the global mean.
The difference becomes even clearer when the researchers examine the cumulative carbon loss. In the negative-emissions experiment, the Southern Ocean’s cumulative flux corresponds to a net release of about 30 parts per million of atmospheric CO₂, or 75 petagrams of carbon. In the zero-emissions experiment, the release is about 8 parts per million, or 38 petagrams of carbon.
Those values change dramatically when the regional gas-transfer coefficient is replaced with the global mean. The modeled Southern Ocean release falls to about 3 parts per million, or 5 petagrams of carbon, in the negative-emissions experiment. In the zero-emissions experiment, the Southern Ocean instead shows a net uptake of roughly 9 parts per million, equivalent to 15 petagrams of carbon. The comparison indicates how strongly the region’s unusually high gas-transfer efficiency amplifies the outgassing response.
The model leaves important uncertainties
The study does not treat these results as a definitive prediction of the future Southern Ocean carbon cycle. The simulations use idealized emission pathways, and the authors note substantial uncertainty in future projections of Southern Ocean carbon uptake because Earth system models have difficulty representing the region’s complex physical and biogeochemical processes.
Surface alkalinity is a particular uncertainty. Its projected response differs substantially among models, and the authors say the CESM2 result needs to be tested against observations. They call for sustained, multidecadal monitoring of the Southern Ocean carbonate system, including alkalinity, to reduce model uncertainty and test whether the simulated behavior persists.
The authors also examined simulations from the Zero Emissions Commitment Model Intercomparison Project. Despite considerable differences among models, all of the models examined showed a similar temporal pattern in which Southern Ocean CO₂ outgassing increased after emissions ceased. The strength of that outgassing varied, which the authors associate with differences in Southern Ocean warming and uncertainty in Southern Hemisphere westerly winds, both of which can affect the gas-transfer coefficient.
One limitation is especially explicit in the main simulations: the Antarctic ice sheet is not represented in the model. The researchers therefore note that the freshwater contribution to their Southern Ocean CO₂ response should be interpreted with that omission in mind.
Within those limits, the simulations produce the same central pattern across the two idealized mitigation pathways. As atmospheric CO₂ falls, the Southern Ocean’s surface remains unusually warm, surface alkalinity continues to decline, oceanic CO₂ partial pressure stays above atmospheric levels, and the region’s high gas-transfer efficiency amplifies the resulting CO₂ release. By 2400, the modeled Southern Ocean has moved from a modest sink to a substantial source, while the global ocean as a whole remains a weak sink.
The study was published in Science Advances.